

A Snapshot of Bicycling in 78 U.S. Cities
By: Rebecca Davies, PeopleForBikes’ bicycle networks data manager
We culled the responses from our annual survey for city officials, painting a more nuanced picture of bicycling at the local level.
Every year, the PeopleForBikes City Ratings is a massive endeavor, utilizing a comprehensive, data-driven approach to evaluate and compare bicycling in U.S. cities and towns, pinpointing areas for improvement at the local level. One of our data inputs is the City Snapshot, a survey asking elected officials to detail what their cities are doing to improve bicycling locally.
While the City Snapshot doesn’t affect scores, it does provide a valuable, measurable look at local progress. In a sea of quantitative data, it also serves as an opportunity to collect qualitative responses, painting a more nuanced picture of the state of bicycling in cities nationwide. The following insights are taken from 79 cities that submitted responses this year.
Summary of Findings
Responses received: 79
States represented: 31 (plus one response from Canada)
Sample job titles of respondents: transportation planner, bicycle planner, transportation engineer, active transportation program manager, sustainability specialist, bicycle and pedestrian outreach coordinator, transportation options coordinator, transportation advisory committee member.
OpenStreetMap
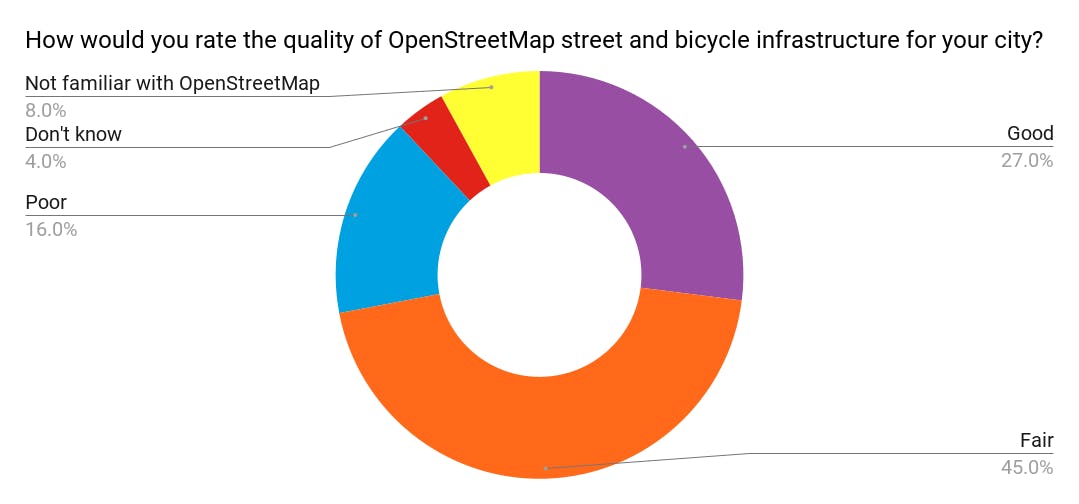
The 2021 City Snapshot asked respondents to rate the quality of OpenStreetMap data for their city. OpenStreetMap is the primary data source we use to produce a city’s Bicycle Network Analysis score, which comprises each city’s Network Score in the City Ratings. OpenStreetMap is the Wikipedia of maps, meaning anyone can edit the data.
Approximately one-quarter of respondents judged OpenStreetMap data to be “Good” for their city and nearly half deemed the data “Fair.” The remainder rated the data as “Poor,” “Don’t know” or were not familiar with OpenStreetMap. Based on this feedback, we see additional room to collaborate with cities, advocates and the civic tech community to further improve the data and our OpenStreetMap editing guidance.
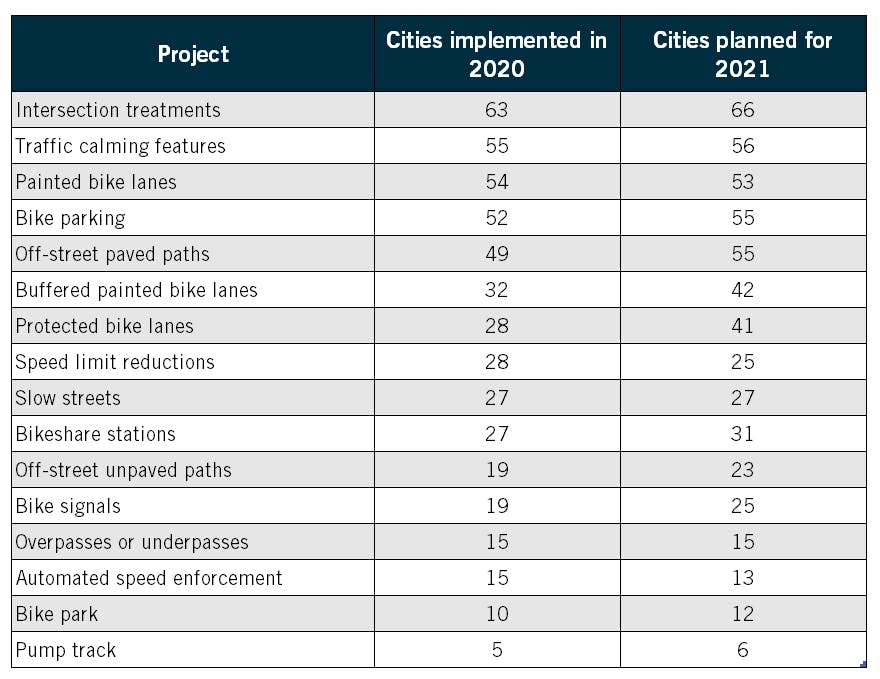
Projects Completed and Planned
The 2021 City Snapshot asked what types of projects cities completed in 2020 and planned for 2021. The responses documented below complement two surveys PeopleForBikes fielded in 2020 asking cities how their bicycle plans adapted to the COVID-19 pandemic. You can find a summary of results from that research here: How Bicycling Changed During A Pandemic.
Additional completed and planned projects include:
- Bike repair stations.
- A cyclocross course in Fayetteville, Arizona.
- Bike counters in Gainesville, Florida.
- Secure bike parking in Jersey City, New Jersey.
- Redesigned streets for outdoor dining and parklets in Santa Monica, California.
- Designated parking zones for dockless bikes and scooters in Grand Rapids, Michigan.
- Bike rest stops in Kettering, Ohio.
- Road diets in Santa Fe, New Mexico and Cleveland, Ohio.
- A children’s educational bike park in Tallahassee, Florida.
- Code revisions in Lawrence, Kansas, to strengthen requirements for bike parking at private developments.
- Repurposing a landfill in Conway, Arkansas, to create new mountain bike trails.
Check out NACTO’s Urban Bikeway Design Guide for project examples and best practices for implementation in any city.
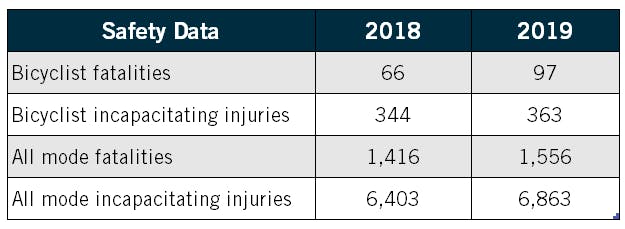
Safety Data
Overall, the responding cities reported increases in fatalities and injuries for all modes of travel between 2018 and 2019, although outcomes varied widely by city. For instance, Tulsa, Oklahoma, countered the overall trend, counting five bicyclists deaths in 2018 and zero in 2019, and 44 all-mode fatalities in 2018 compared to 36 in 2019.
The City Ratings score calculation no longer includes safety data and the City Snapshot will not request safety data in the future. However, closely tracking deaths and injuries is critical for cities to evaluate bicycle network outcomes and prevent future deaths and injuries through better road design. We know that 2020 was an especially deadly year for road users, including people on bikes, illustrating an urgent need to make our streets and intersections safer for people using all modes of transportation.
Cities reporting fatality data: 53
Cities reporting injury data: 44
Cities that distinguished between incapacitating vs. non-incapacitating injury data: 37
Equity Initiatives
For the first time, the City Snapshot asked an open-ended question about what cities are doing to address equity in their bike planning. We received a number of great responses demonstrating different approaches to incorporating equity into bicycling networks, programs and outreach. A few of these initiatives are summarized below.
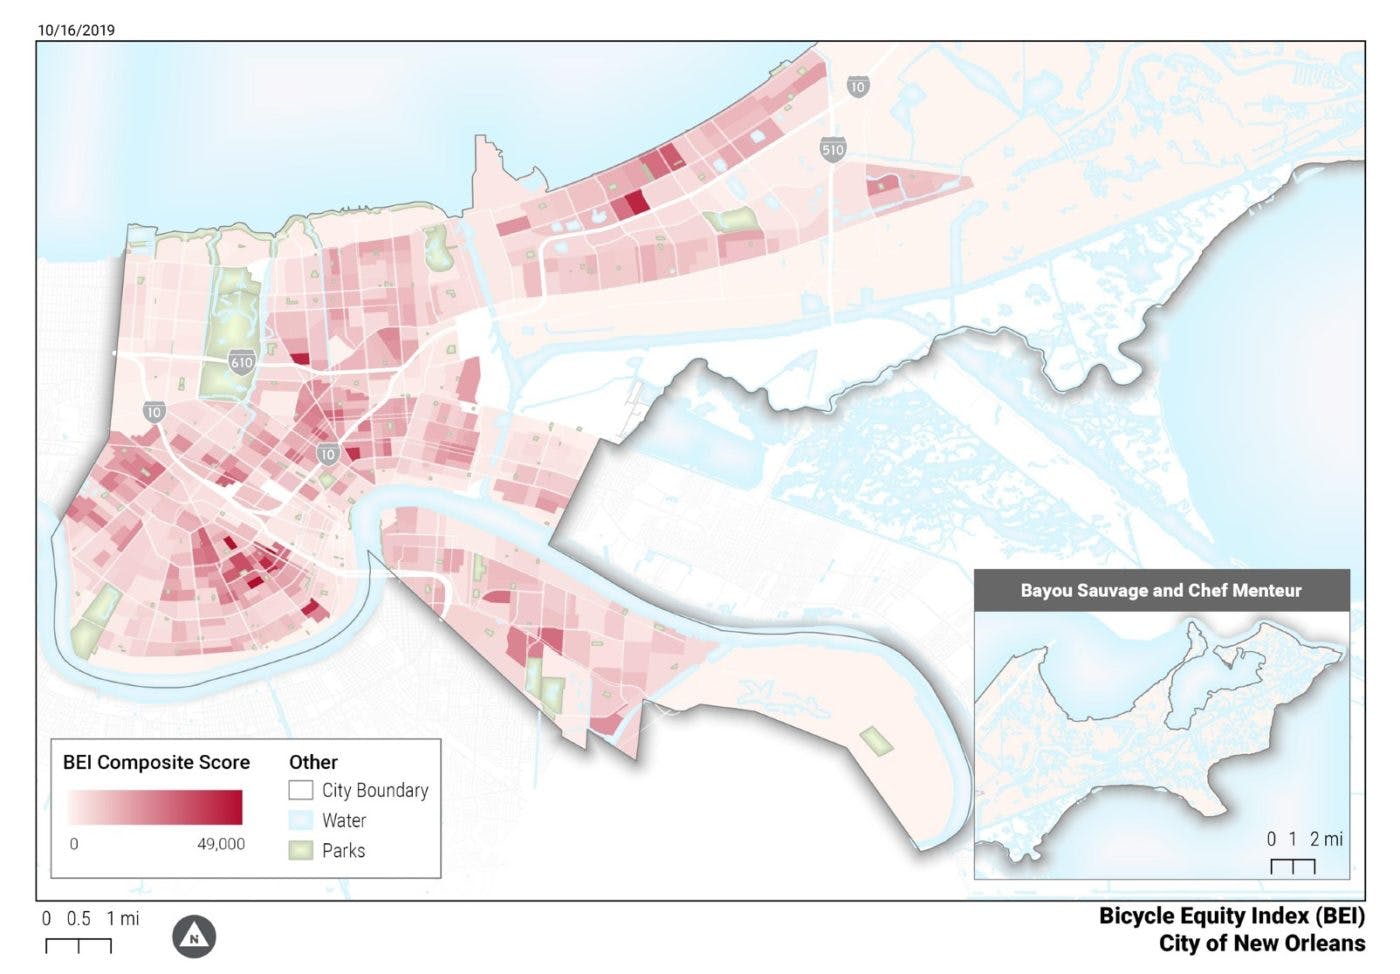
New Orleans, Louisiana, applies a Bicycle Equity Index to identify areas to target for transportation improvements. The index includes five metrics that provide context for decision-making, such as transit dependence and environmental justice.
Madison, Wisconsin, applies a citywide tool to review programs using a racial equity and social justice lens. The city also works with Neighborhood Resource Teams to validate proposed changes.
Lawrence, Kansas, tracks equitable transportation access for disadvantaged communities with a particular focus on designated Environmental Justice Zones.
In Conway, Arkansas, a bike planner reviews crashes involving bikes to evaluate the role of the built environment, a practice that can identify the consequences of dangerous road design rather than focusing blame on people.
Lincoln, Nebraska, incorporates race and income demographics into project evaluation criteria and implementation.
Additional responses from Northampton, Massachusetts; Jersey City, New Jersey; Ferndale, Michigan; Cleveland, Ohio; Tallahassee, Florida and Tulsa, Oklahoma, noted that the cities prioritize bike projects in BIPOC and low-income communities.
City Ratings Feedback
Another new question this year gauged the usefulness of PeopleForBikes’ City Ratings when it comes to improving bicycling locally. Respondents cited a number of ways City Ratings supports their work, including:
- Benchmarking progress against peer cities.
- Creating competitive pressure to improve.
- Serving as a promotional tool to engage the community and garner support.
- Providing an annual tracking metric and “gut check.”
- Highlighting successes.
- Helping identify gaps and weaknesses.
- Collecting feedback from residents via the Community Survey.
Respondents also gave helpful feedback on how PeopleForBikes can improve the program:
- Ease the burden of updating OpenStreetMap to generate more accurate network scores.
- Draft a more consistent annual calendar for City Ratings deadlines, including the Community Survey, City Snapshot and OpenStreetMap updates.
- Provide easier access to the underlying data that informs the scores.
- Craft more detailed recommendations based on the results.
- Better explain scores that stray far from expectations, particularly given the heavy influence of residential speed limits on overall scores.
Looking Ahead
Next year, we intend to further simplify and shorten the City Snapshot. We will remove questions about planned and completed infrastructure, bike share trips and safety data,
shifting the focus of the survey to ask questions that will help us improve Network Score accuracy and gather feedback on the City Ratings as an advocacy tool.
Thank you to the cities that submitted a City Snapshot in 2021 and in years past. We invite city officials to sign up to receive the 2022 City Snapshot, which will help PeopleForBikes further strengthen the City Ratings and capture the important work cities are doing to enable more people to ride bikes.
Not a city official? Support the City Ratings project by filling out our Community Survey or petitioning to add your city.
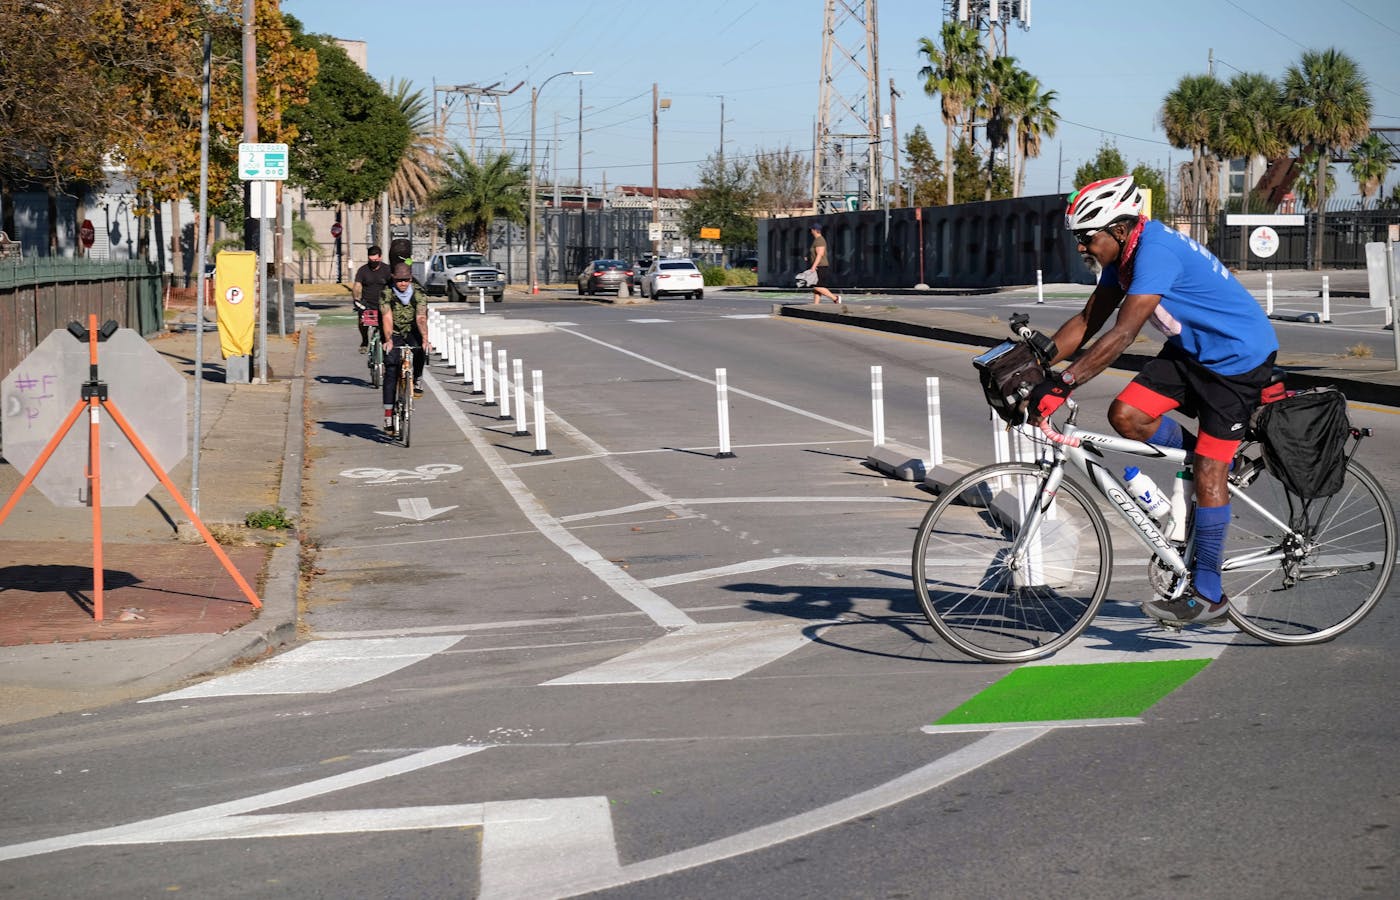
Photos From the City Snapshot
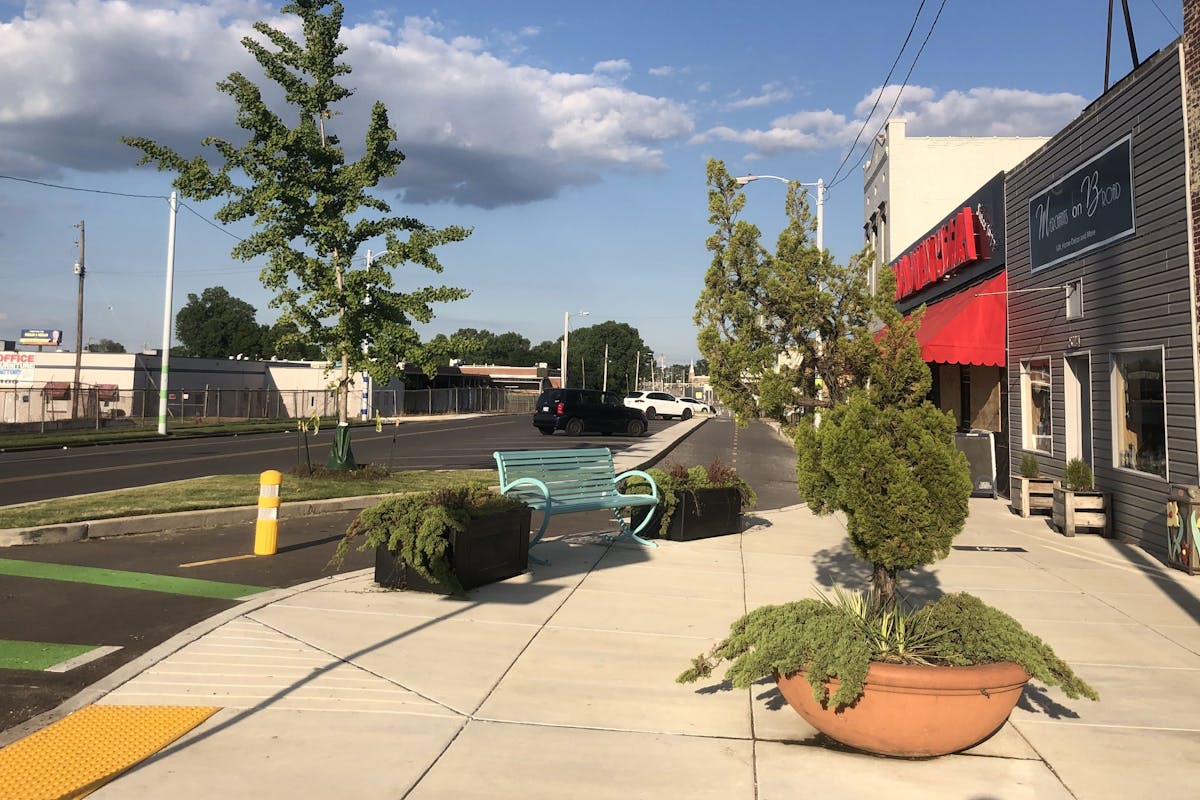
City officials sent the following photographs alongside their snapshot submissions. Imagine if all the amazing bike infrastructure showcased were actually from one (incredible) city!
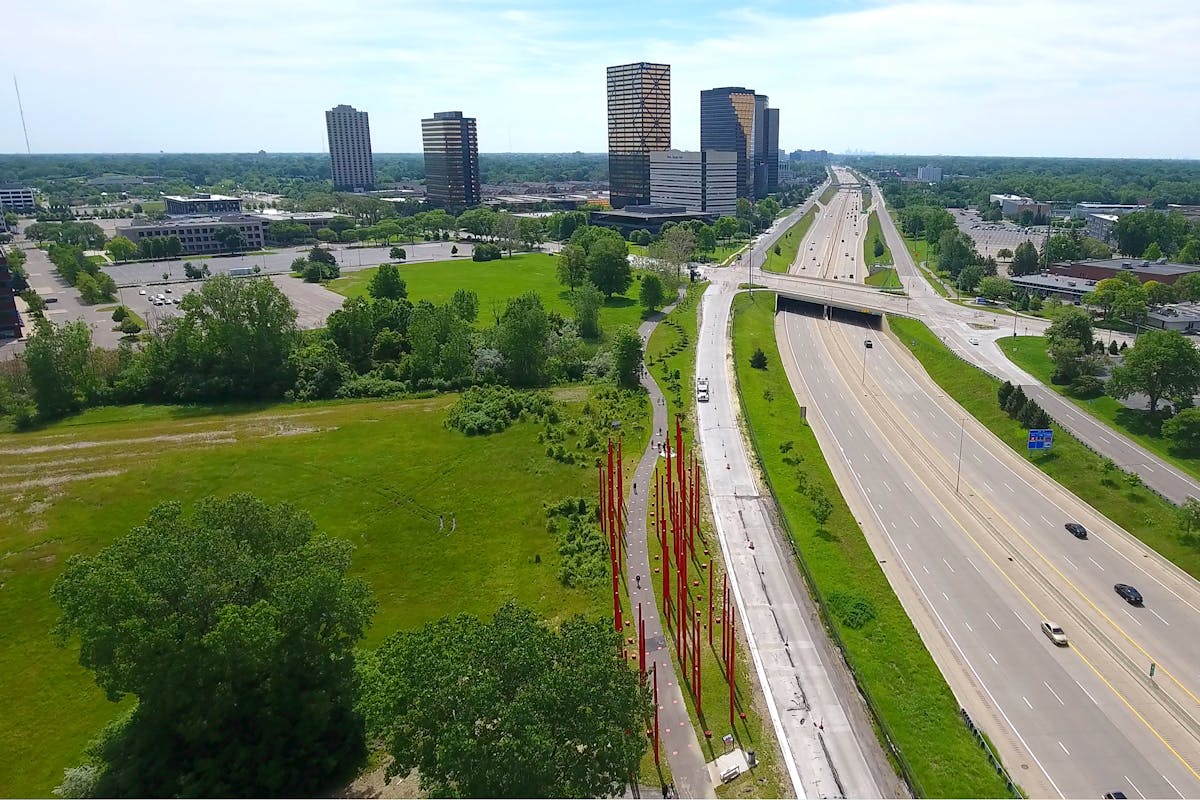
Red Pole Park and multi-use path in Southfield, Michigan.
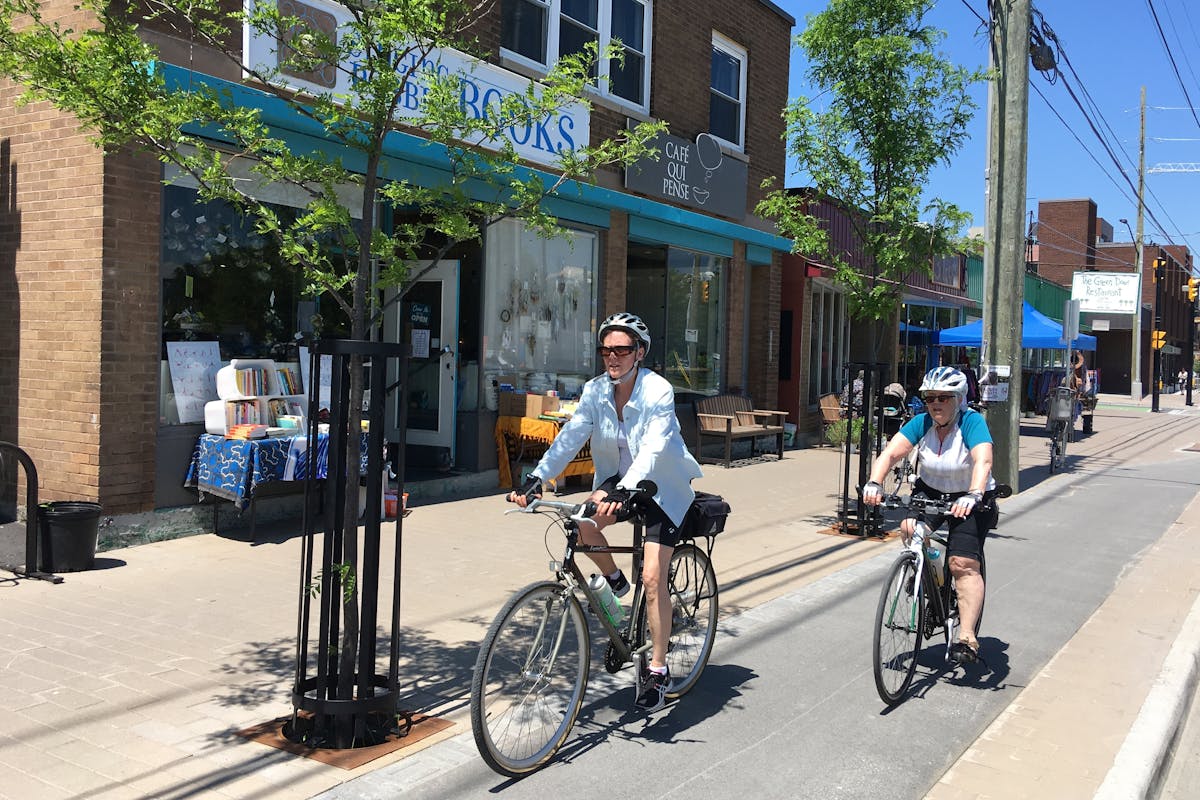
Protected bike lane in Ottawa, Ontario.
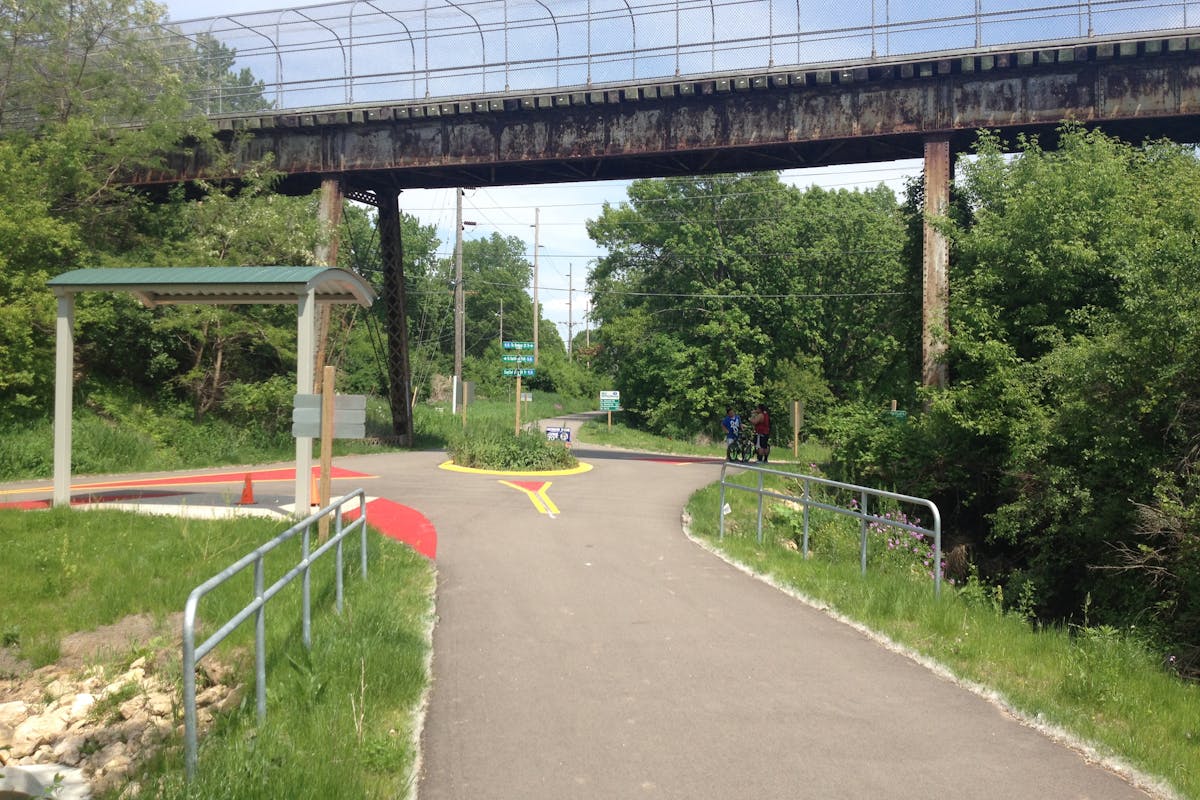
Off-street paths intersect in Fitchburg, Wisconsin.
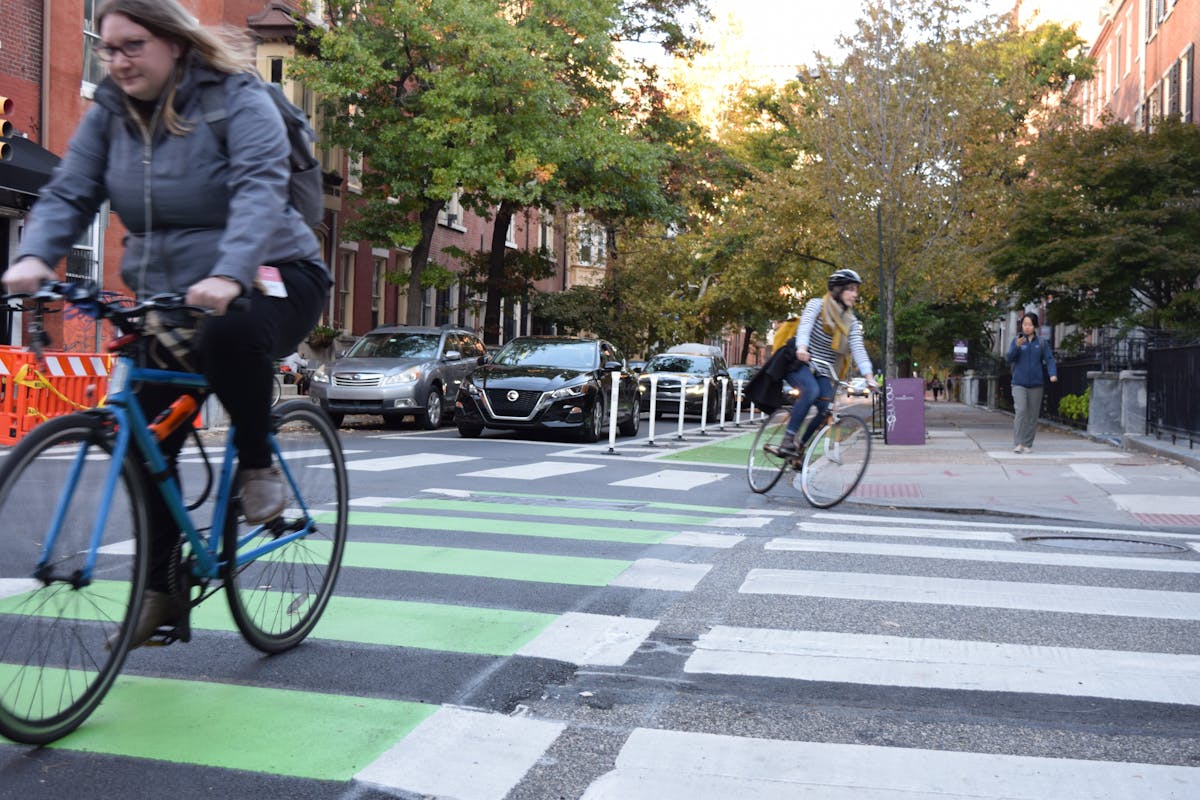
Protected bike lane in Philadelphia, Pennsylvania.
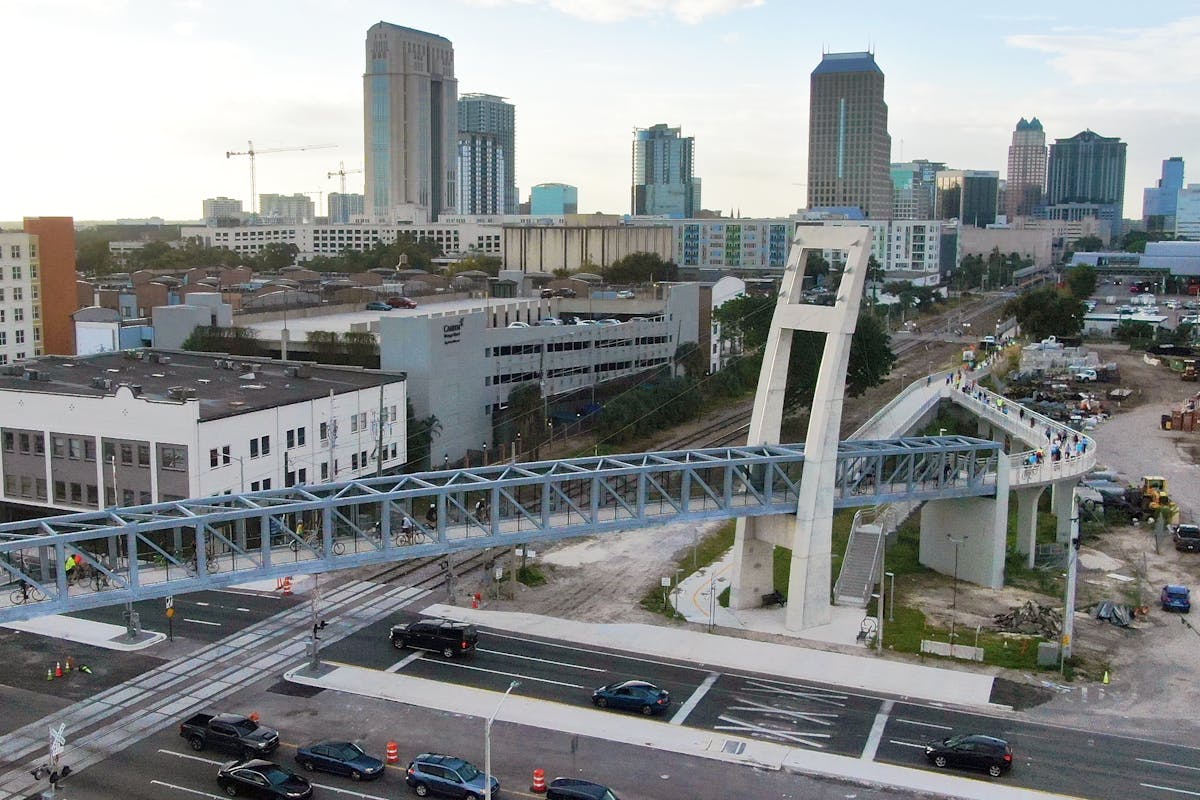
Colonial Bridge bike/pedestrian overpass in Orlando, Florida.
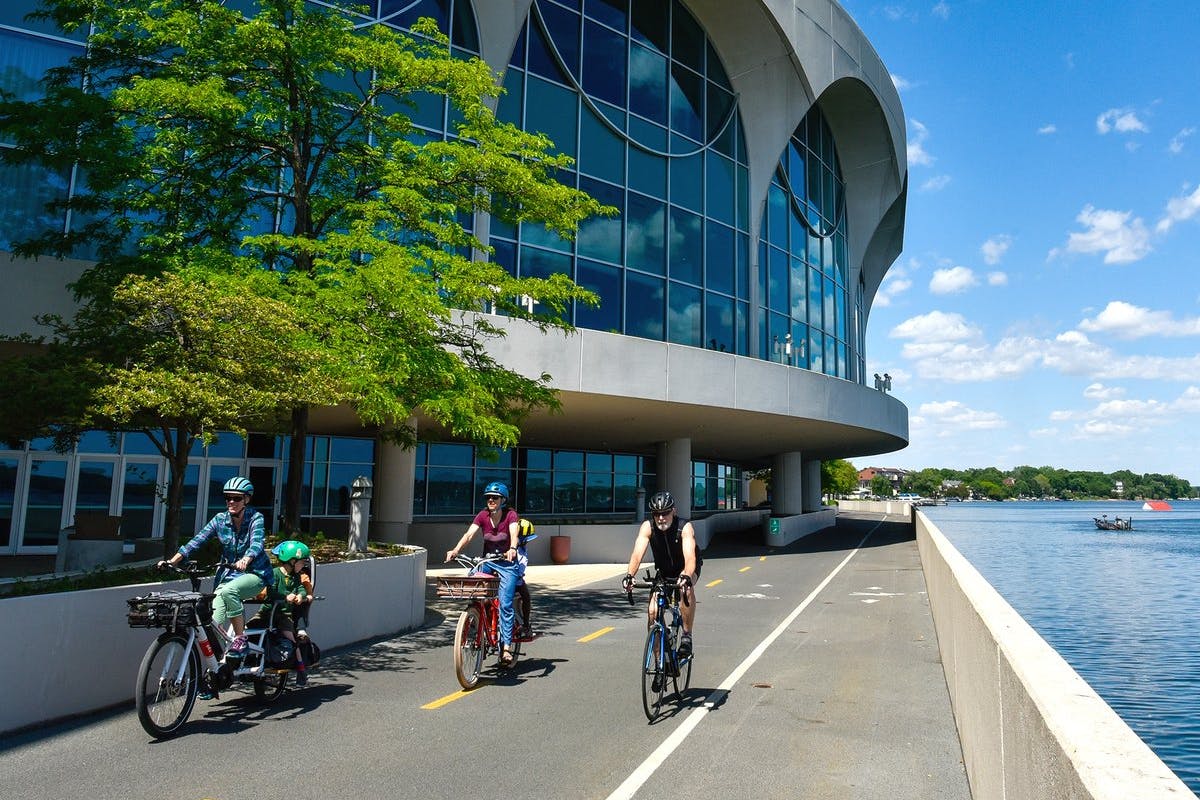
Off-street lakefront path in Madison, Wisconsin.
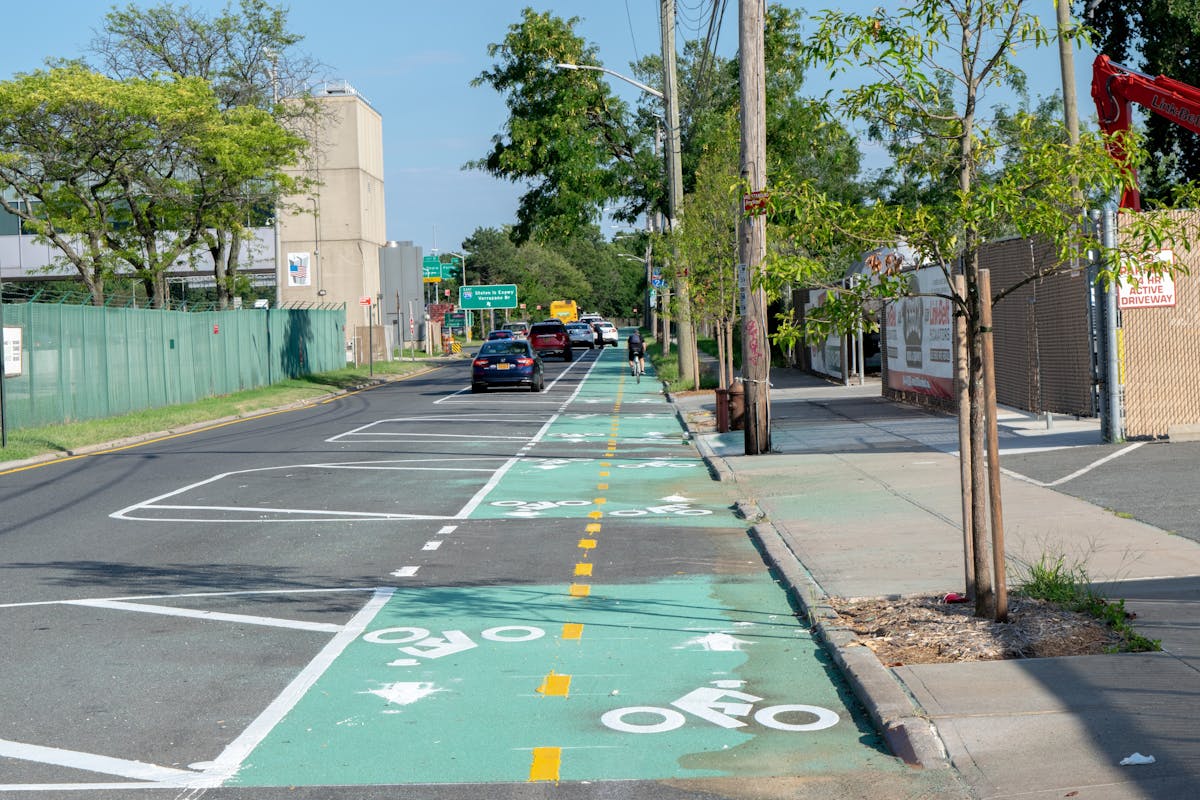
Parking protected two-way bike lane in Staten Island, New York.
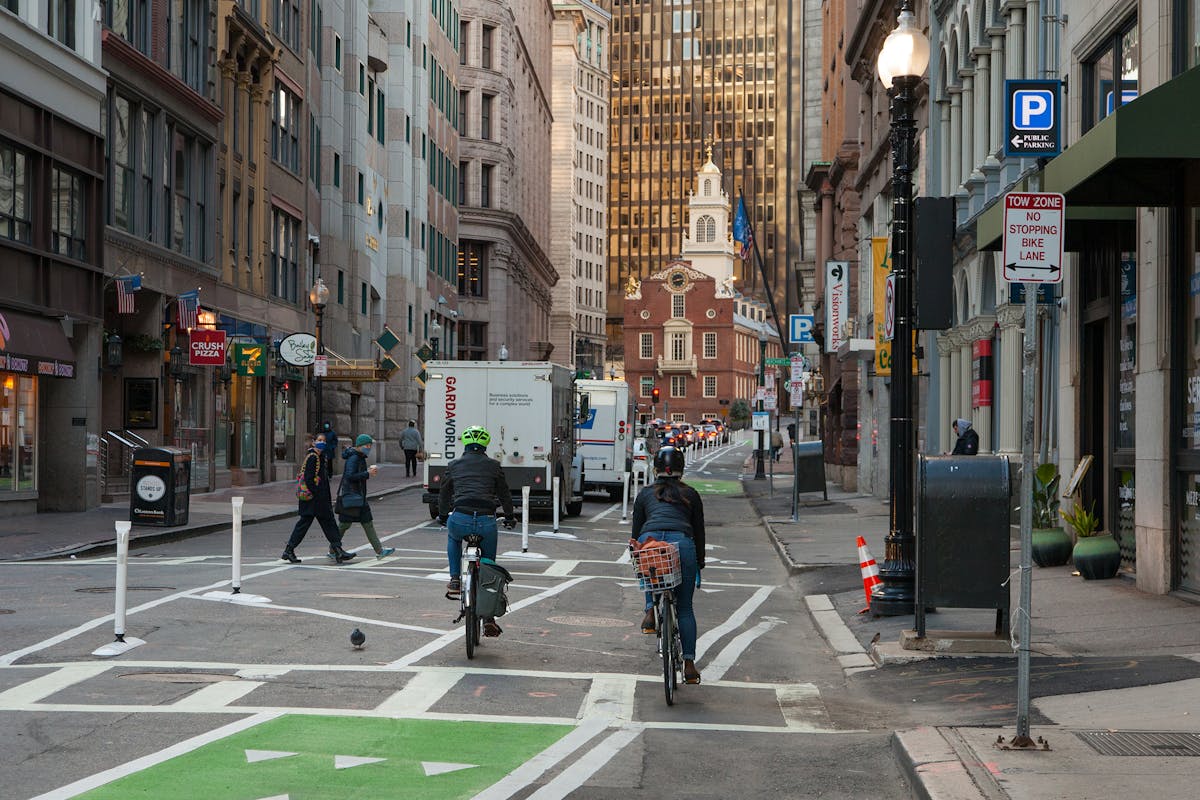
Protected bike lane in Boston, Massachusetts.
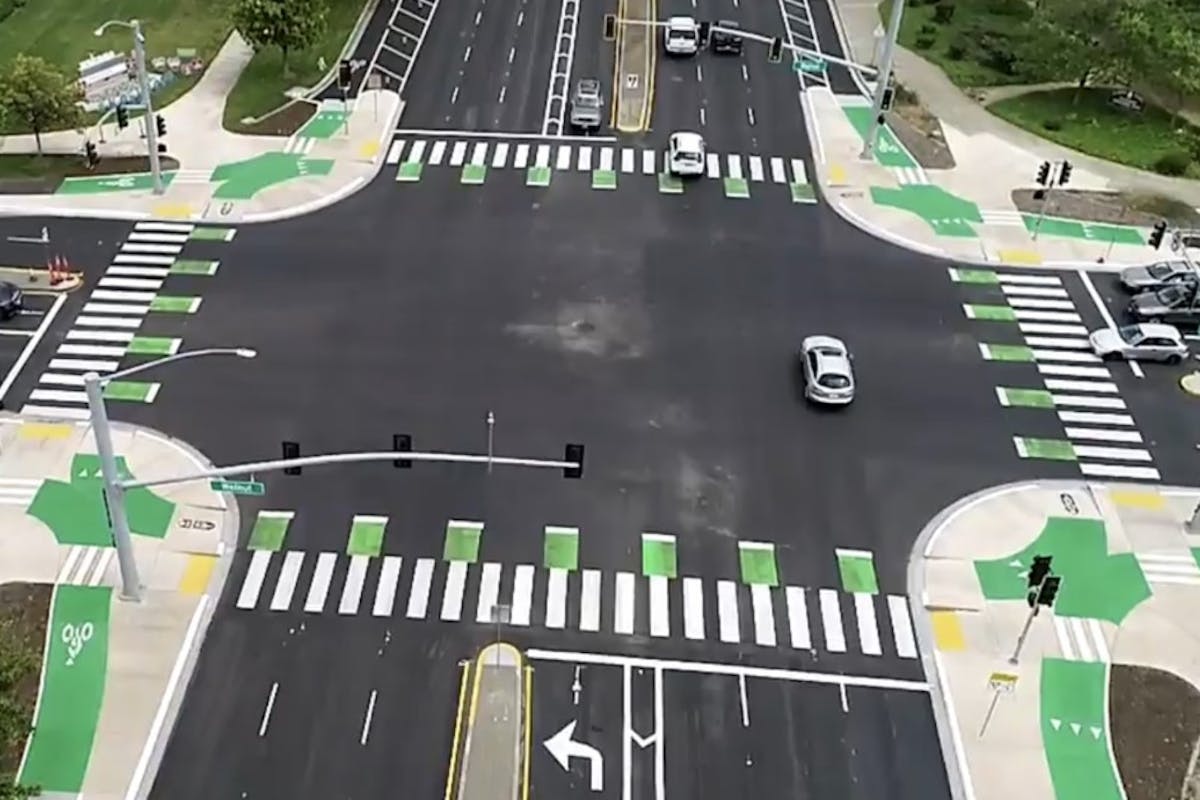
Protected bike intersection in Fremont, California.
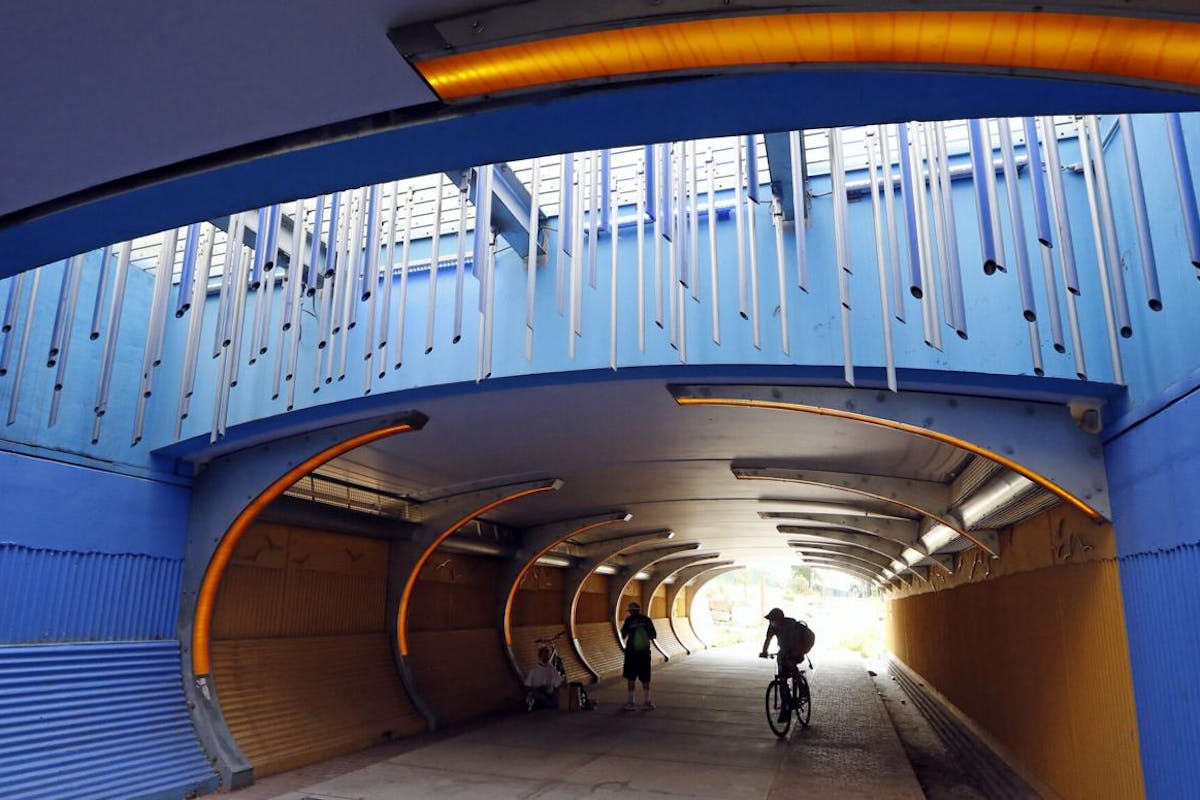
A bike/pedestrian underpass in Santa Fe, New Mexico.
Two-way protected bike lane in Memphis, Tennessee.
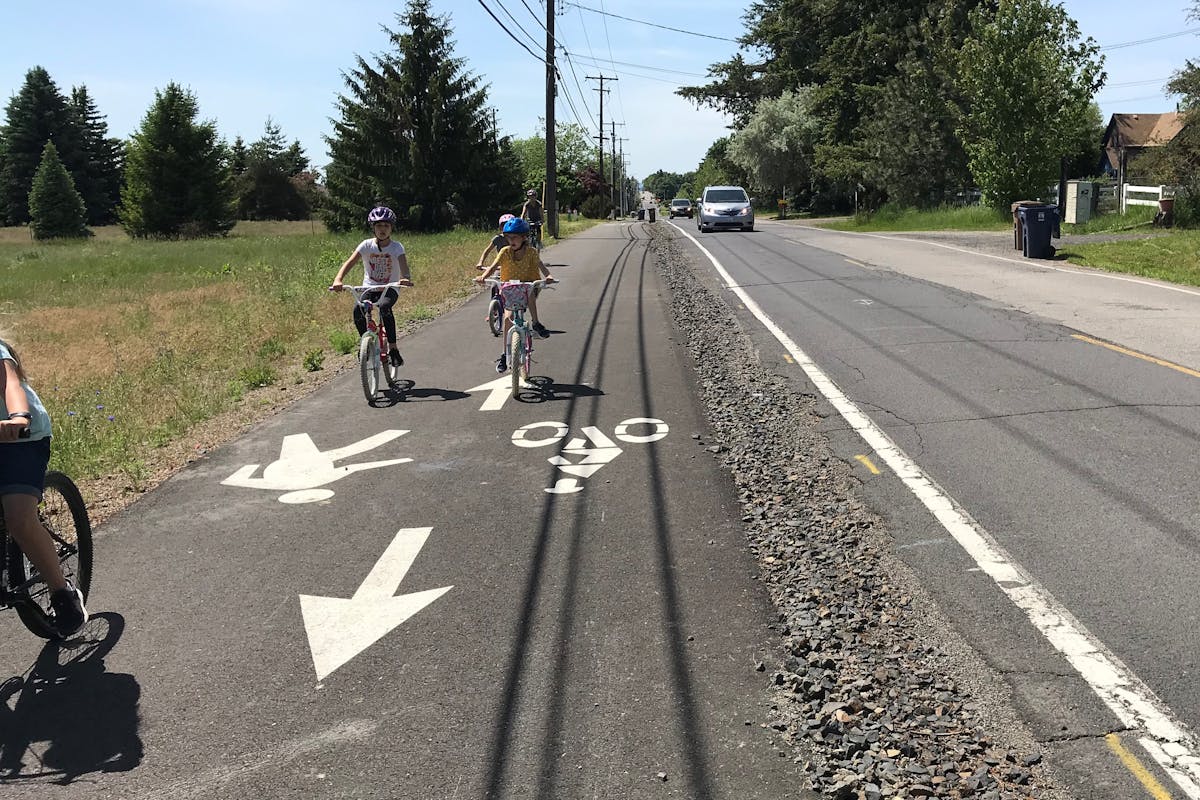
Off-street path in Spokane, Washington.
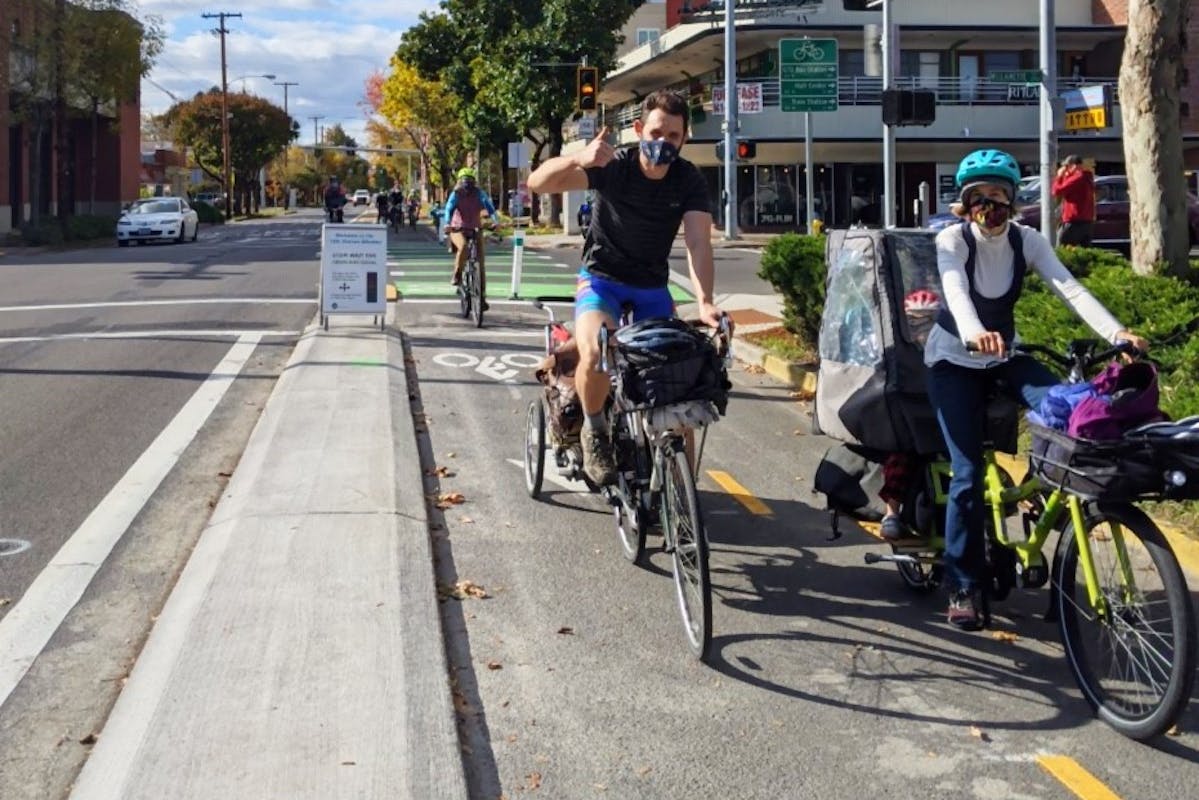
Two-way protected bike lane in Eugene, Oregon.
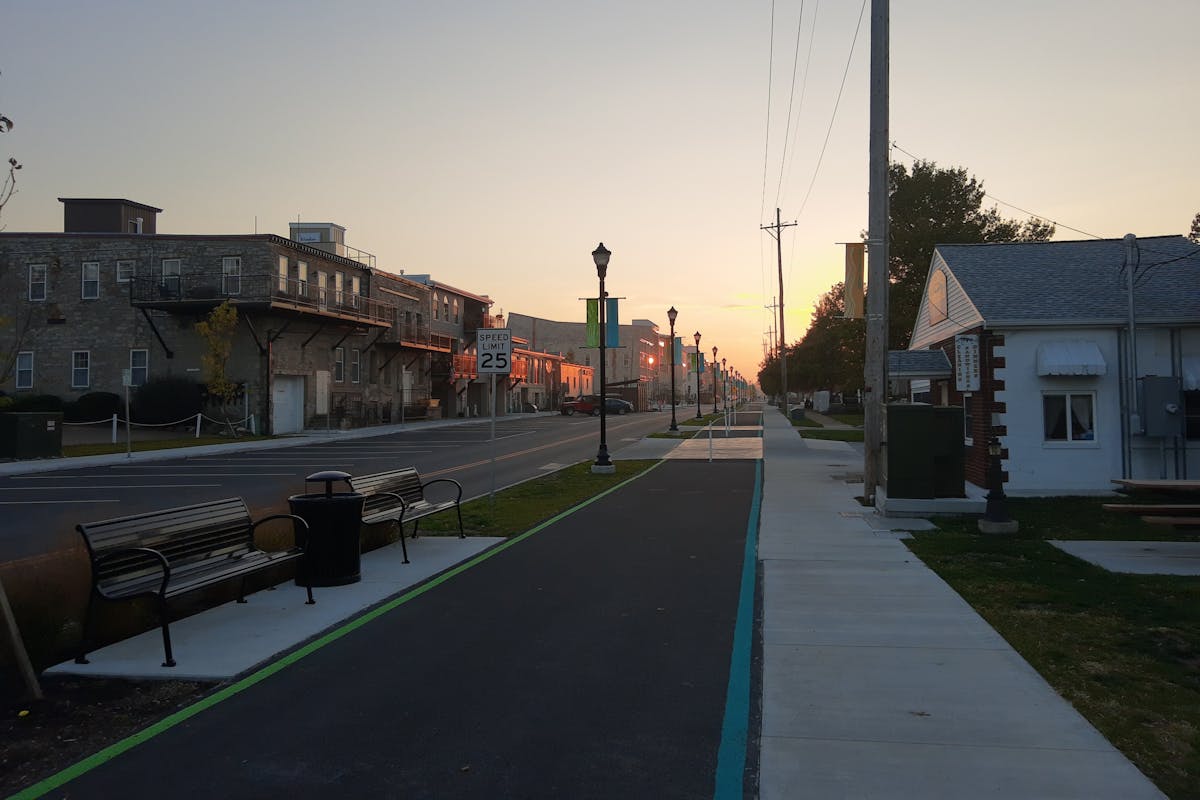
Sandusky Bay Pathway in Sandusky, Ohio.
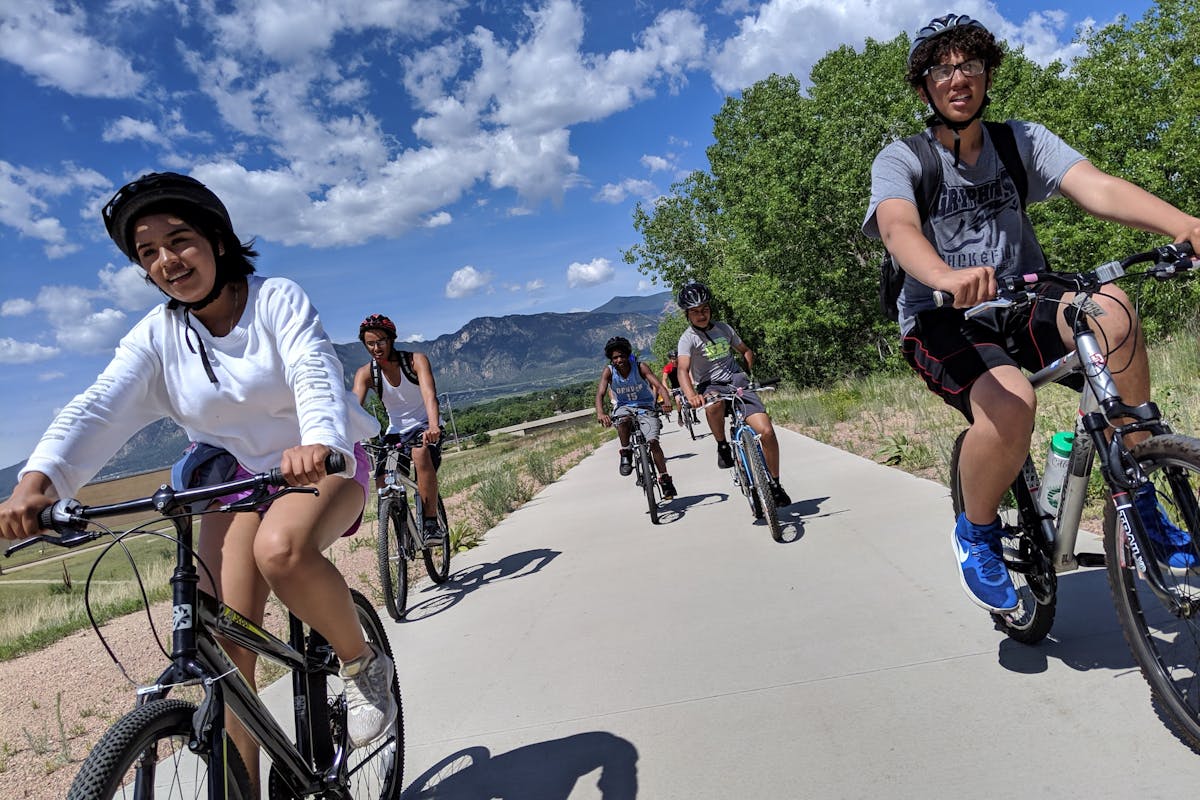
An off-street path in Colorado Springs, Colorado.
Related Topics:

Take Action
