

Rising Standards, Better Results: U.S. Cities Continue to Improve for Bicycling
By: Grace Stonecipher, Infrastructure Analytics and Research Manager
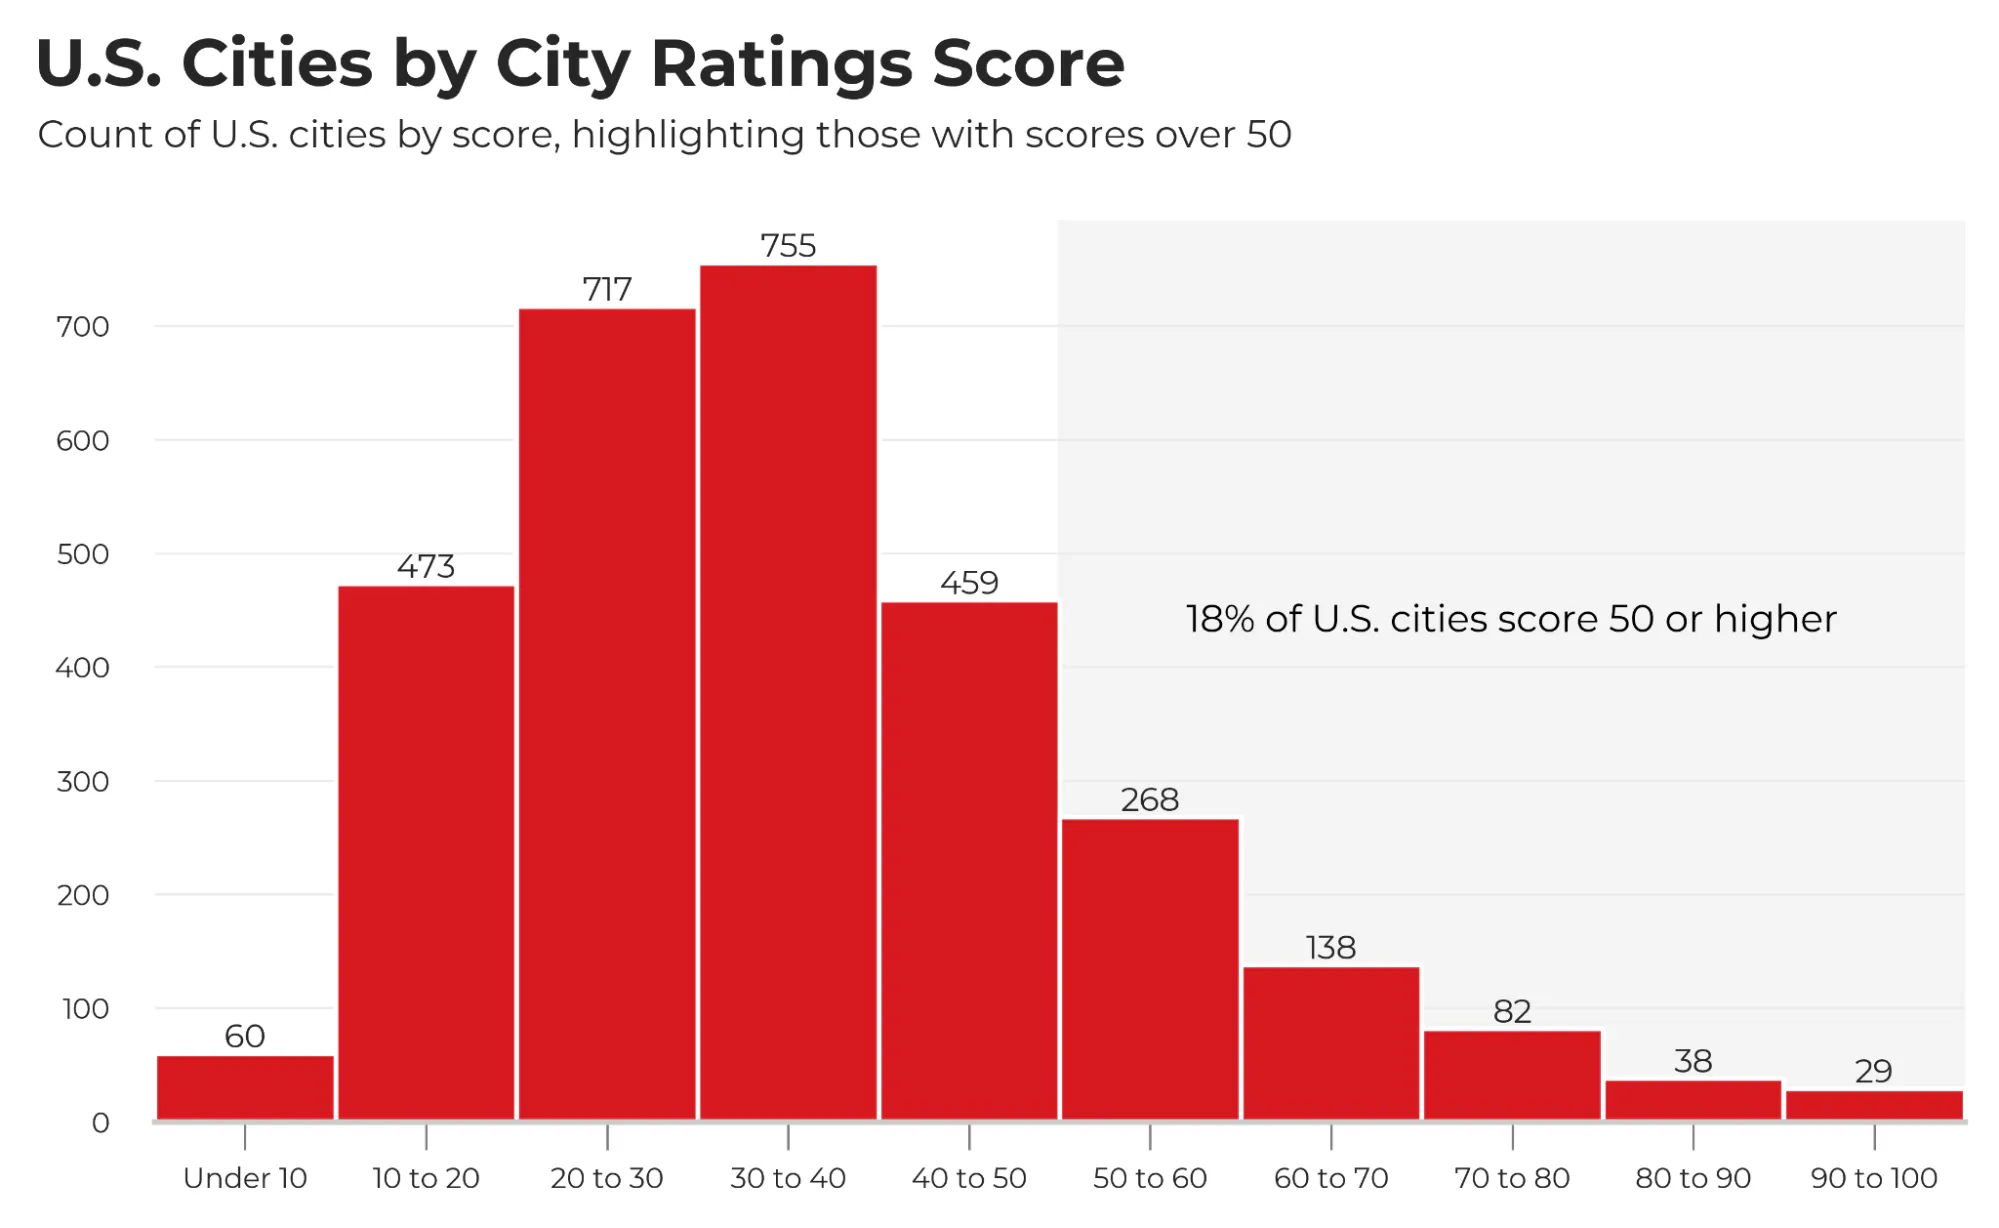
American cities are building better bike networks, and the numbers in PeopleForBikes’ 2026 City Ratings reflect it: 555 cities scored 50 or higher, up from 234 in 2025.
Now in its ninth year, PeopleForBikes’ annual City Ratings takes a data-driven look at bikeability in more than 3,000 cities across the U.S. Scores are generated using the Bicycle Network Analysis (BNA), which measures how easily people can reach everyday destinations such as jobs, schools, parks, grocery stores, and essential services via connected, safe, and low-stress bike routes.
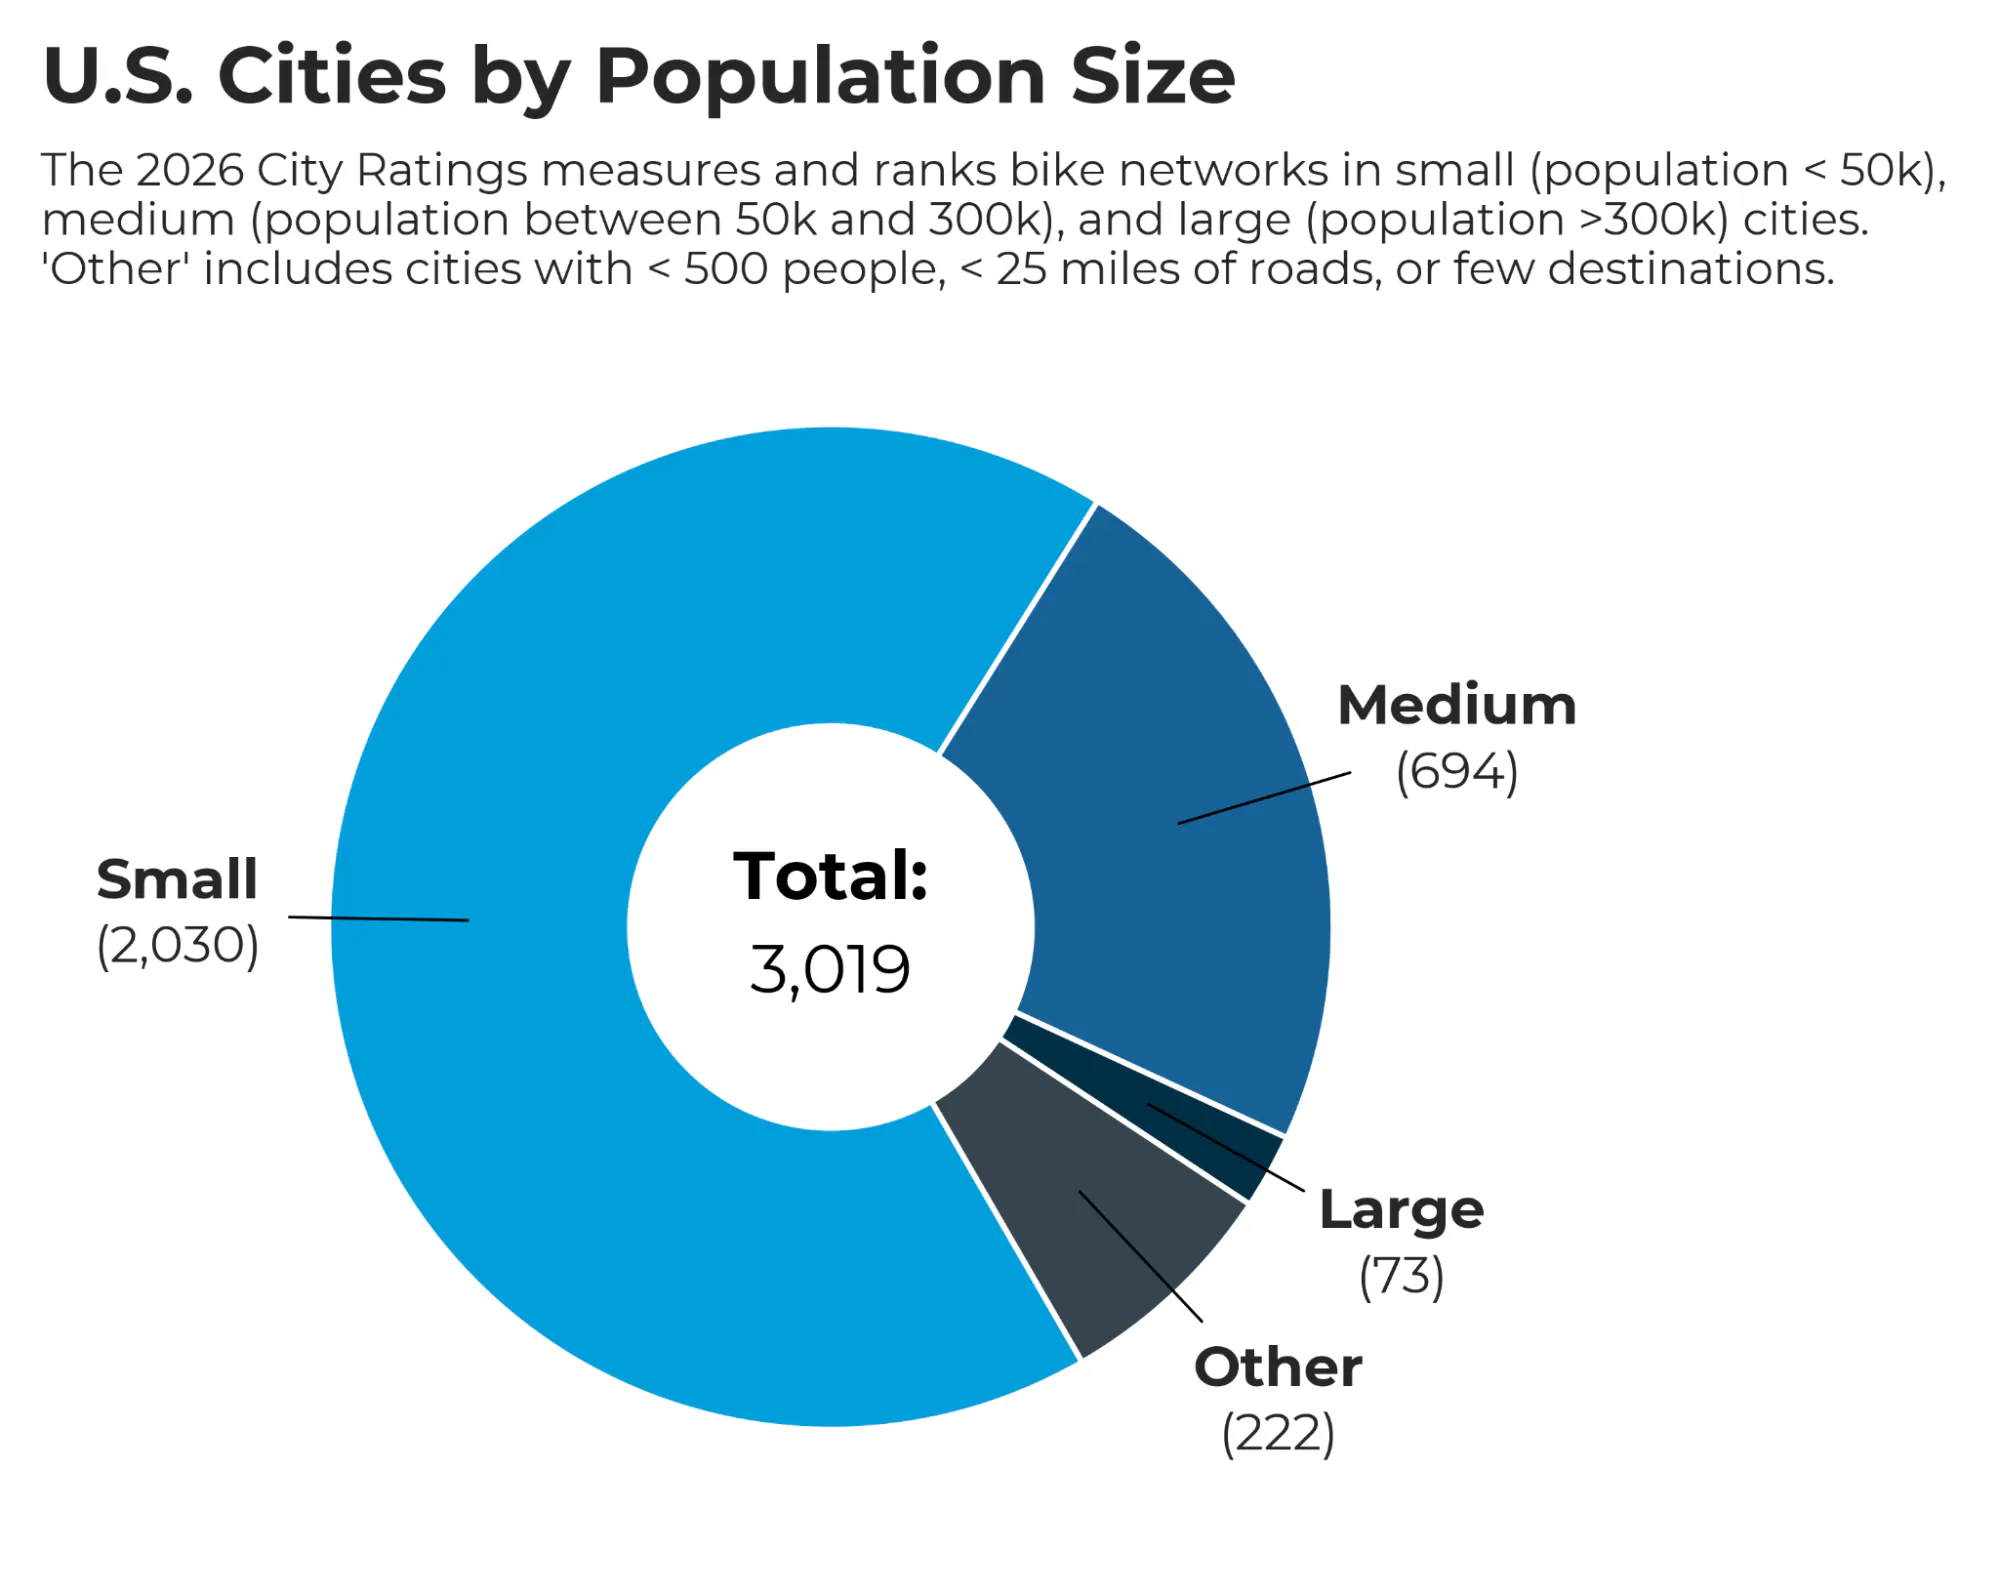
Cities are scored on a scale of 0–100 and grouped by population size: small (under 50,000), medium (50,000–300,000), and large (more than 300,000). A score of 50 represents a critical tipping point: at that level, a city's low-stress network is connected enough to generate real momentum toward broader bikeability. Updated annually, City Ratings gives city leaders and local advocates a consistent benchmark to track progress and make the case for investment.
A Growing Program
The 2026 City Ratings includes some notable methodology updates, incorporating the most up-to-date data, best practices in street design, and feedback from City Ratings users. Some cities may see score changes that reflect the updated methodology rather than recent infrastructure changes, and year-over-year comparisons should be interpreted with that in mind. By introducing these new improvements, PeopleForBikes establishes a consistent baseline from which future annual changes can more reliably reflect real progress on the ground. More detail about these changes can be found in this blog and webinar.
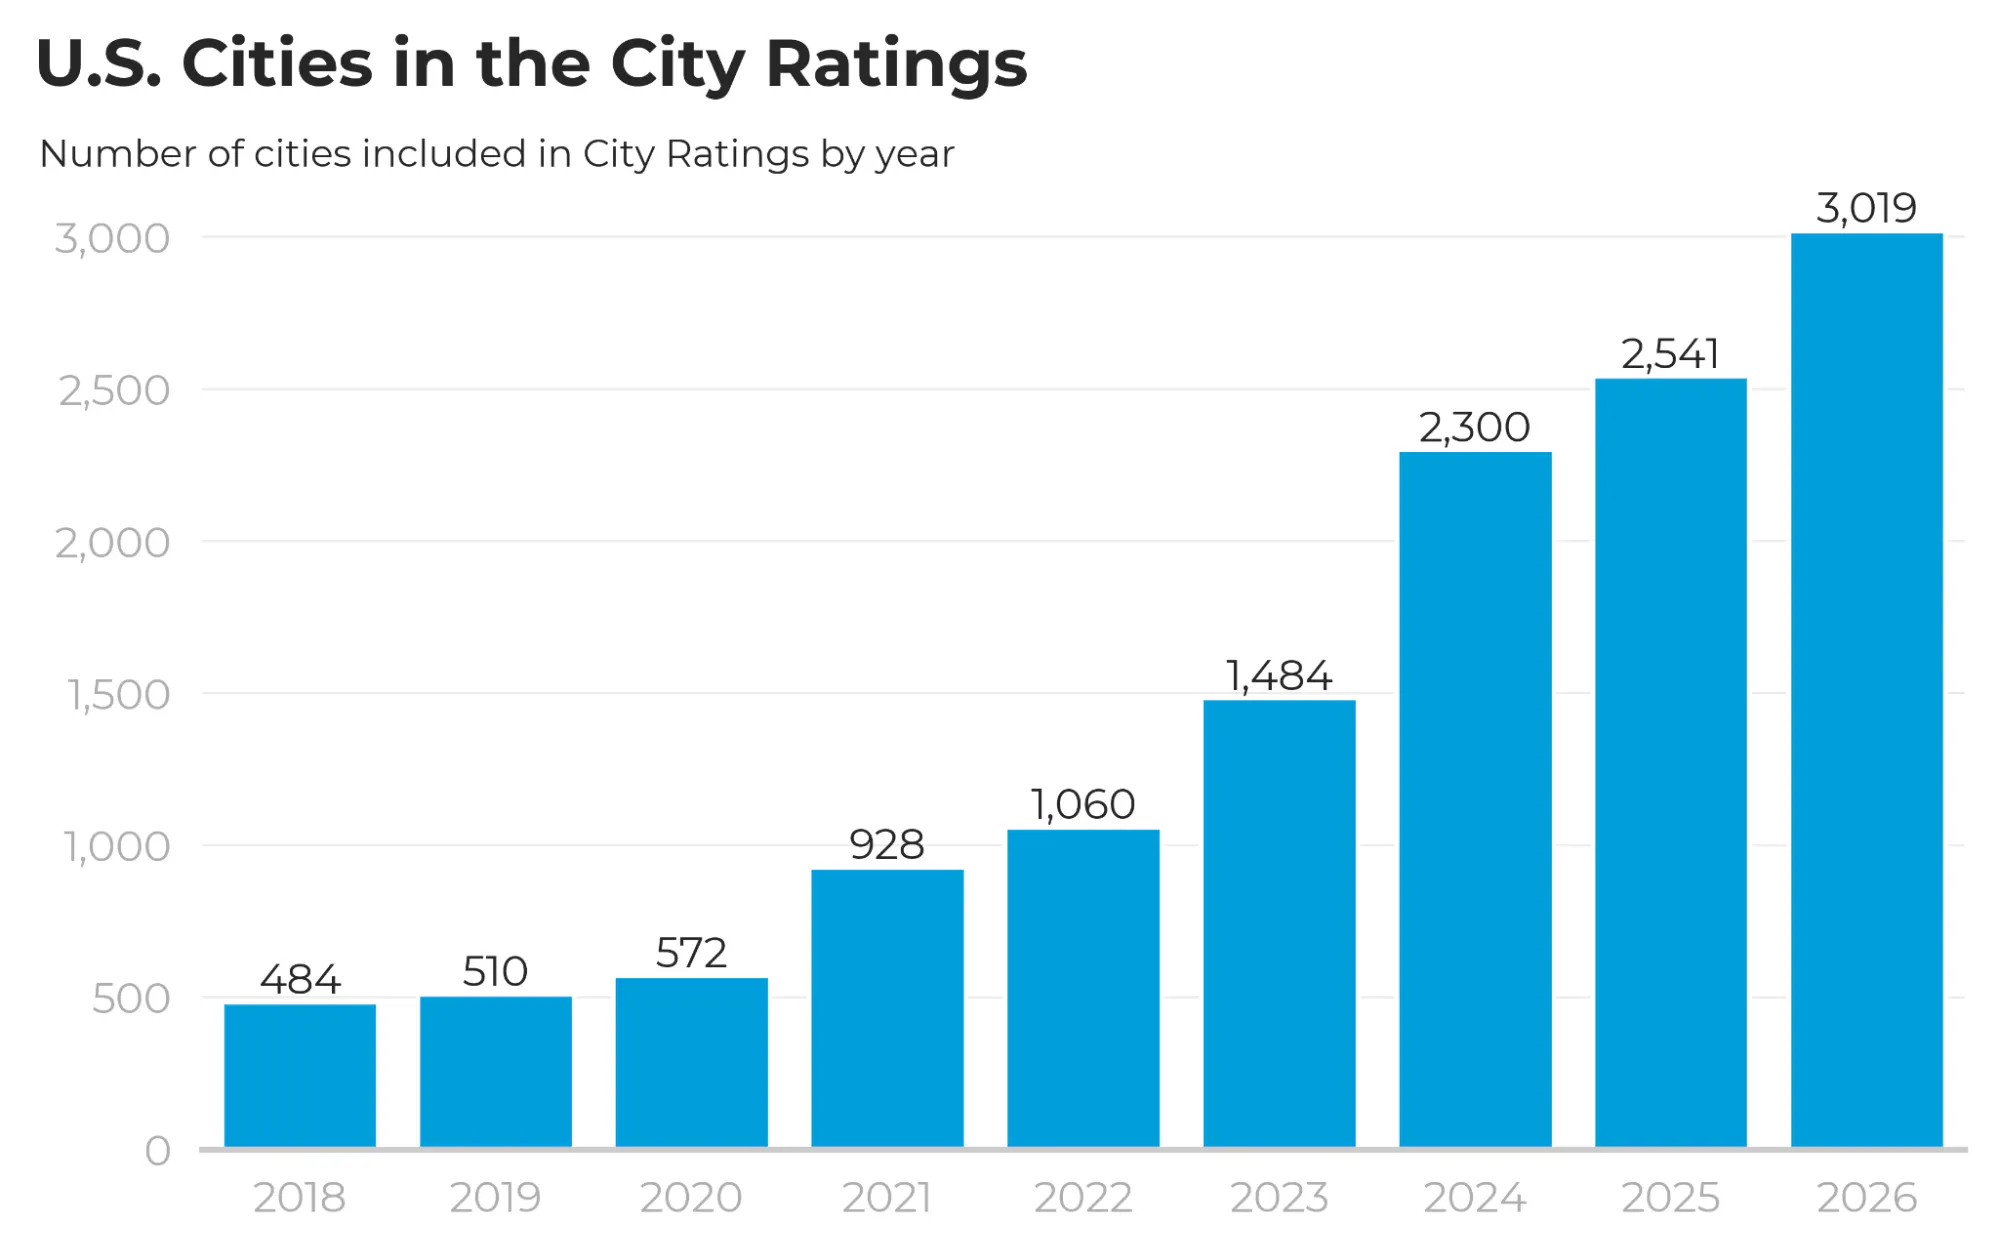
The 2026 City Ratings added nearly 500 new U.S. cities (448 small and 42 medium) for a total of 3,019. A new "other" category captures a subset of small cities that don't meet a set of minimum criteria (500+ residents, 25+ miles of roads, destinations in at least four categories). The 222 cities in this category receive scores but are not included in size-based rankings. Similar to 2025, New York City is split into its five boroughs to better reflect the variation in bike network quality across the city.
Top Cities: Familiar Names and New Arrivals
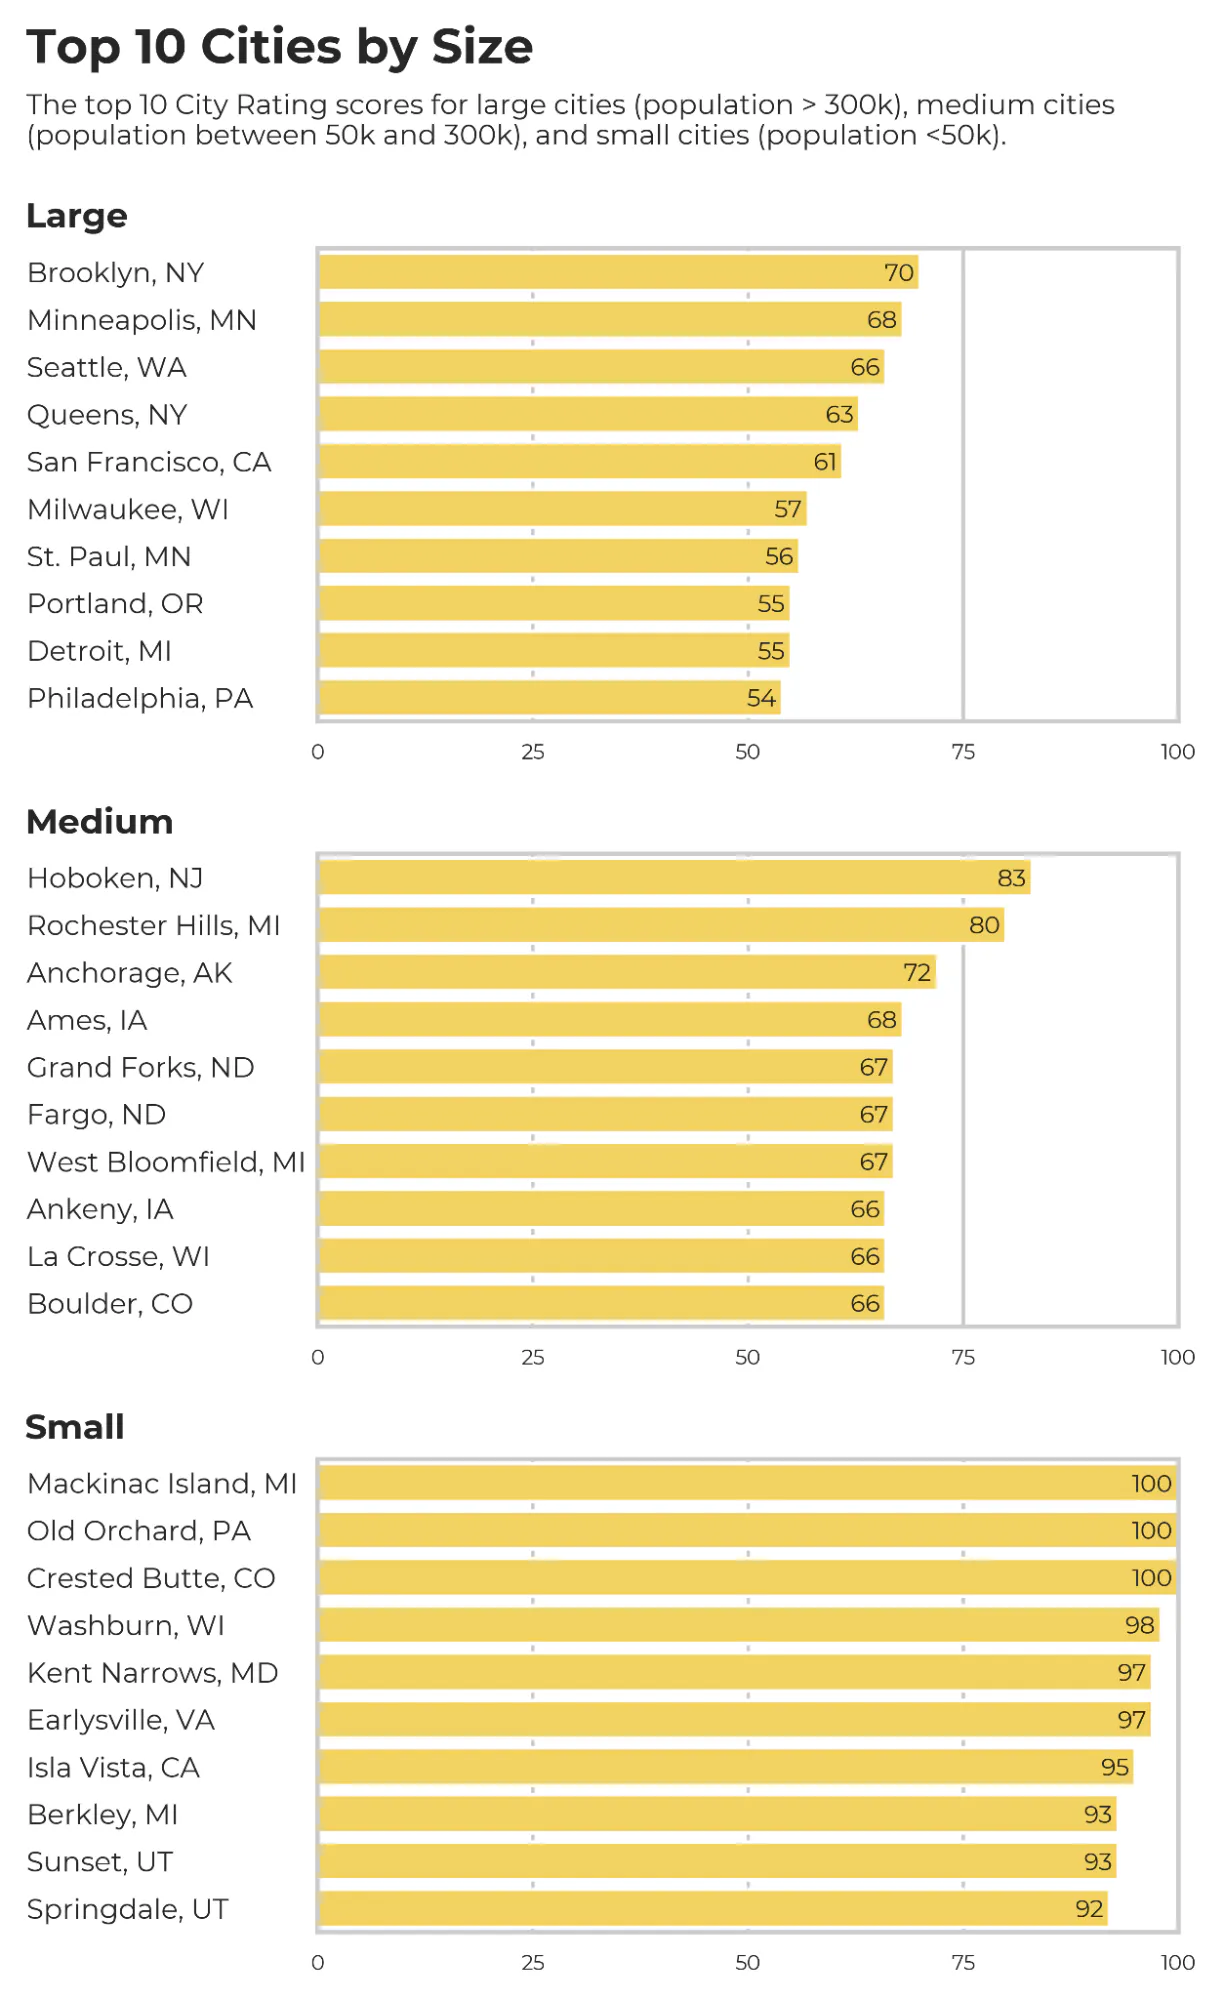
This year’s top five large U.S. cities are the same as 2025 — Brooklyn (70), Minneapolis (68), Seattle (66), Queens (63), and San Francisco (61), with a few scores dropping slightly due to methodology updates. Milwaukee (57) entered the top 10 this year as the city met its goal to build 50 miles of protected bikeways by 2026. Detroit (55) also entered the top 10 as the city continues to build out the Joe Louis Greenway, a nearly 30-mile route around the city. Similar to last year, all of the top 10 large cities scored above 50, indicating a continued commitment to improving infrastructure in metropolitan areas.
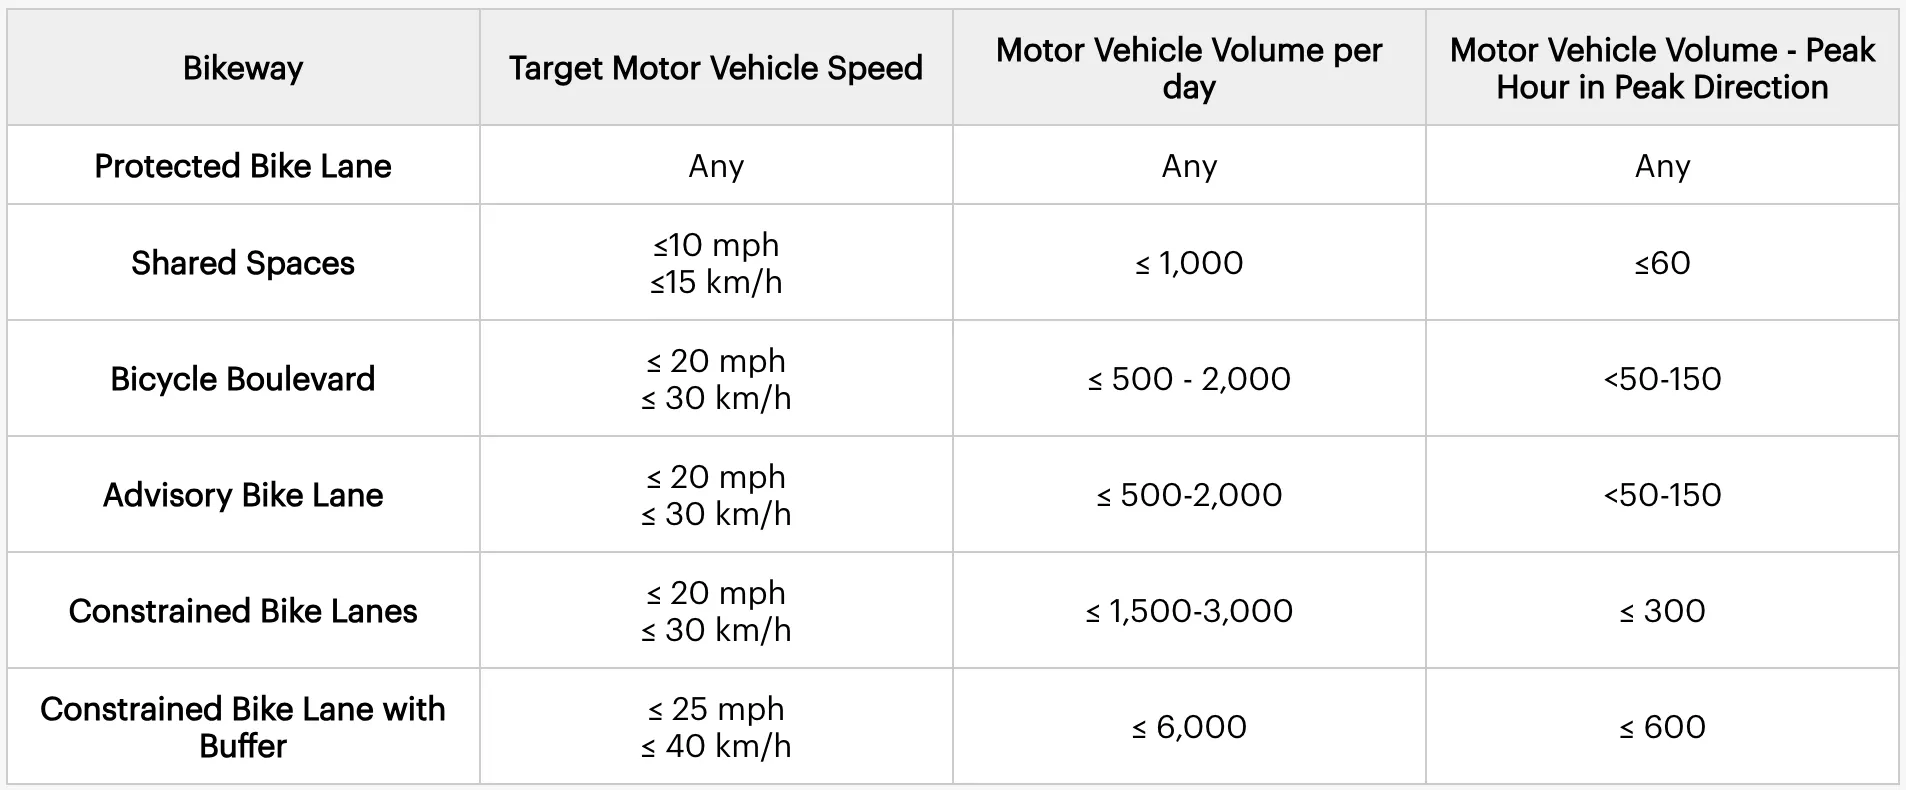
The top 10 medium cities saw significant turnover due to updated guidelines from the National Association of City Transportation Officials (NACTO). Under these guidelines, conventional (paint-only) bike lanes must be on roads with speed limits of 20 mph or lower to be considered low-stress infrastructure. In many medium-sized cities, the speed limits on non-residential roads are higher, and the BNA now considers them high-stress when considering all ages and abilities.
Hoboken, NJ (83) took over the top spot for medium U.S. cities this year, reflecting the city’s initiatives towards Vision Zero, or the elimination of all traffic related injuries and deaths by 2030. While much of the bike infrastructure is conventional, a citywide speed limit of 20 mph means that most of the roads are low-stress. Many Heartland cities are also in the top 10, bolstered by extensive networks of paved trails running throughout the area, providing low-stress connections and separation from cars.
Mackinac Island, MI, continues to top the small cities with a perfect score of 100, reflecting the absence of cars on the small island. Old Orchard, PA and Crested Butte, CO also reached scores of 100 this year. As with Mackinac, almost every road in these areas is low-stress. In some communities, such as Washburn, WI, a low-stress network in small cities can be achieved due to low speed limits, as opposed to extensive bike infrastructure. In other places, a key piece of infrastructure may help connect an entire city, such as the Cross Island Trail in Kent Narrows, MD, or the Zion Canyon Trail in Springdale, UT.
Progress Holds Even as the Bar Rises
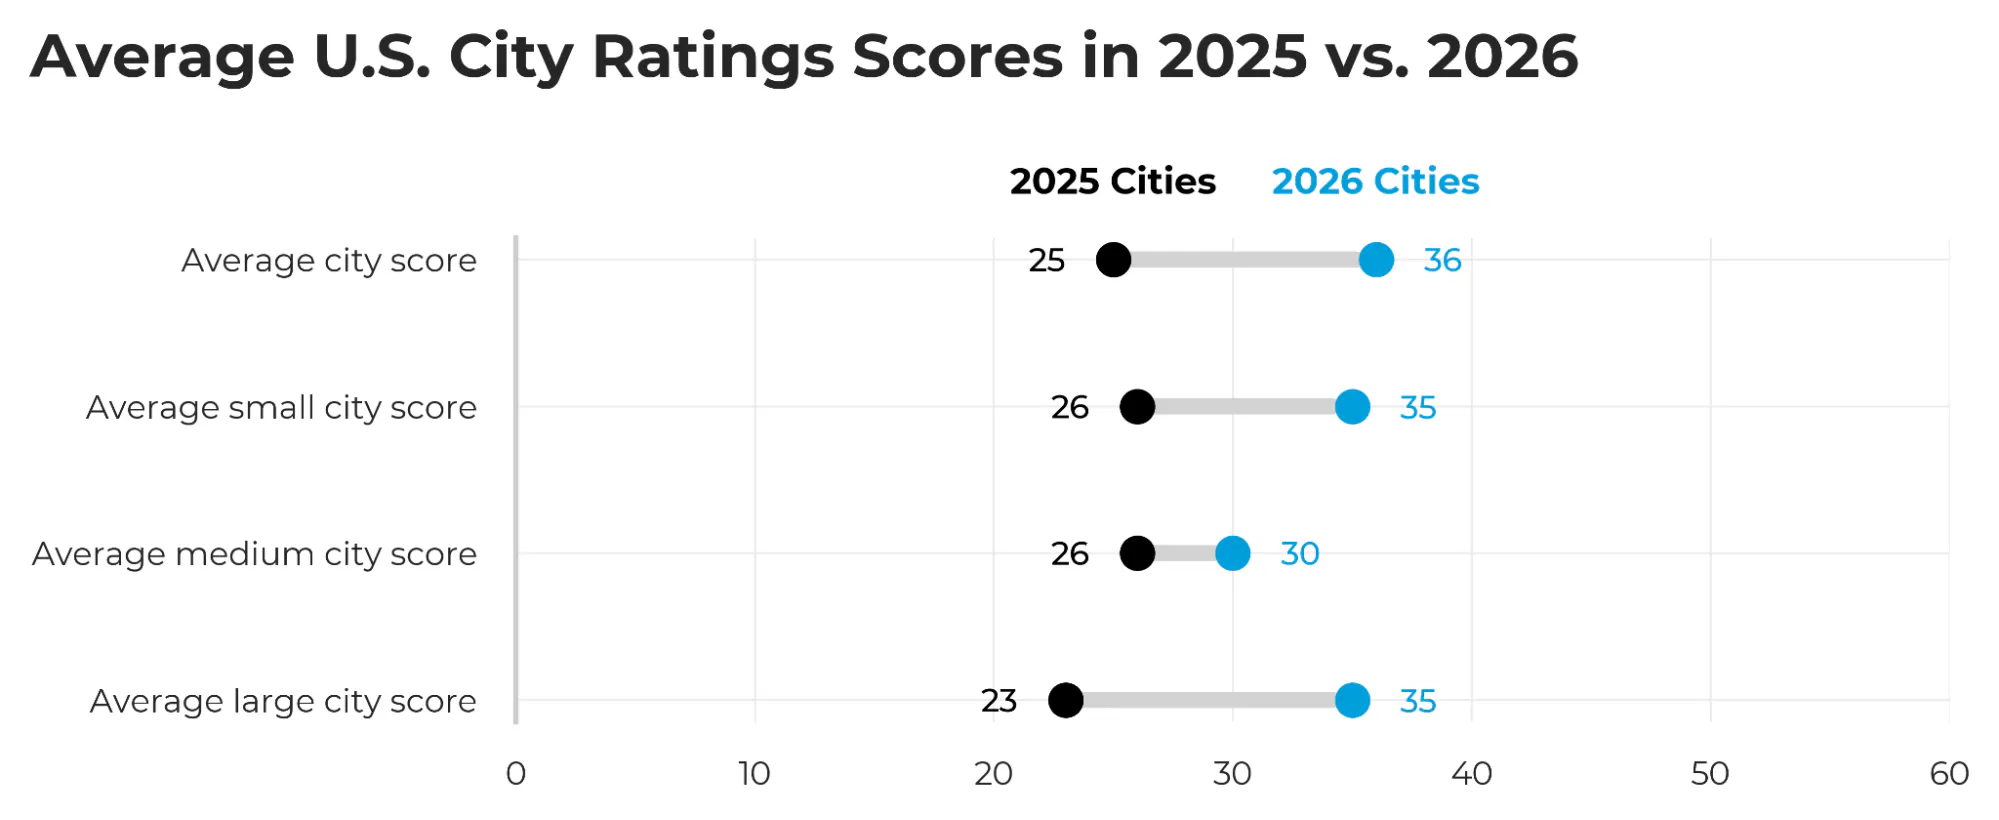
Despite the stricter requirements for defining low-stress infrastructure, average scores went up significantly across all categories this year. Across all U.S. cities, the average City Ratings score increased from 25 to 36. This increase was reflected across all size categories as well, though less significantly for medium-sized cities. The largest gain came in large cities, where the average score rose 12 points with cities such as Tampa, FL, and Columbus, OH, seeing double-digit increases.
In 2026, 555 cities scored 50 or above, up from 234 in 2025. Of these high-scoring cities, 137 were new to the program, 187 maintained a score of 50+, and 231 cities crossed the tipping point for the first time. 500 are small cities, 44 are medium, and 11 are large.
Ingredients for a High Score
High-scoring cities tend to exhibit many or all of the components of PeopleForBikes’ SPRINT framework:
- Safe speeds
- Protected bike lanes
- Reallocated space for biking and walking
- Intersection treatments
- Network connections
- Trusted data
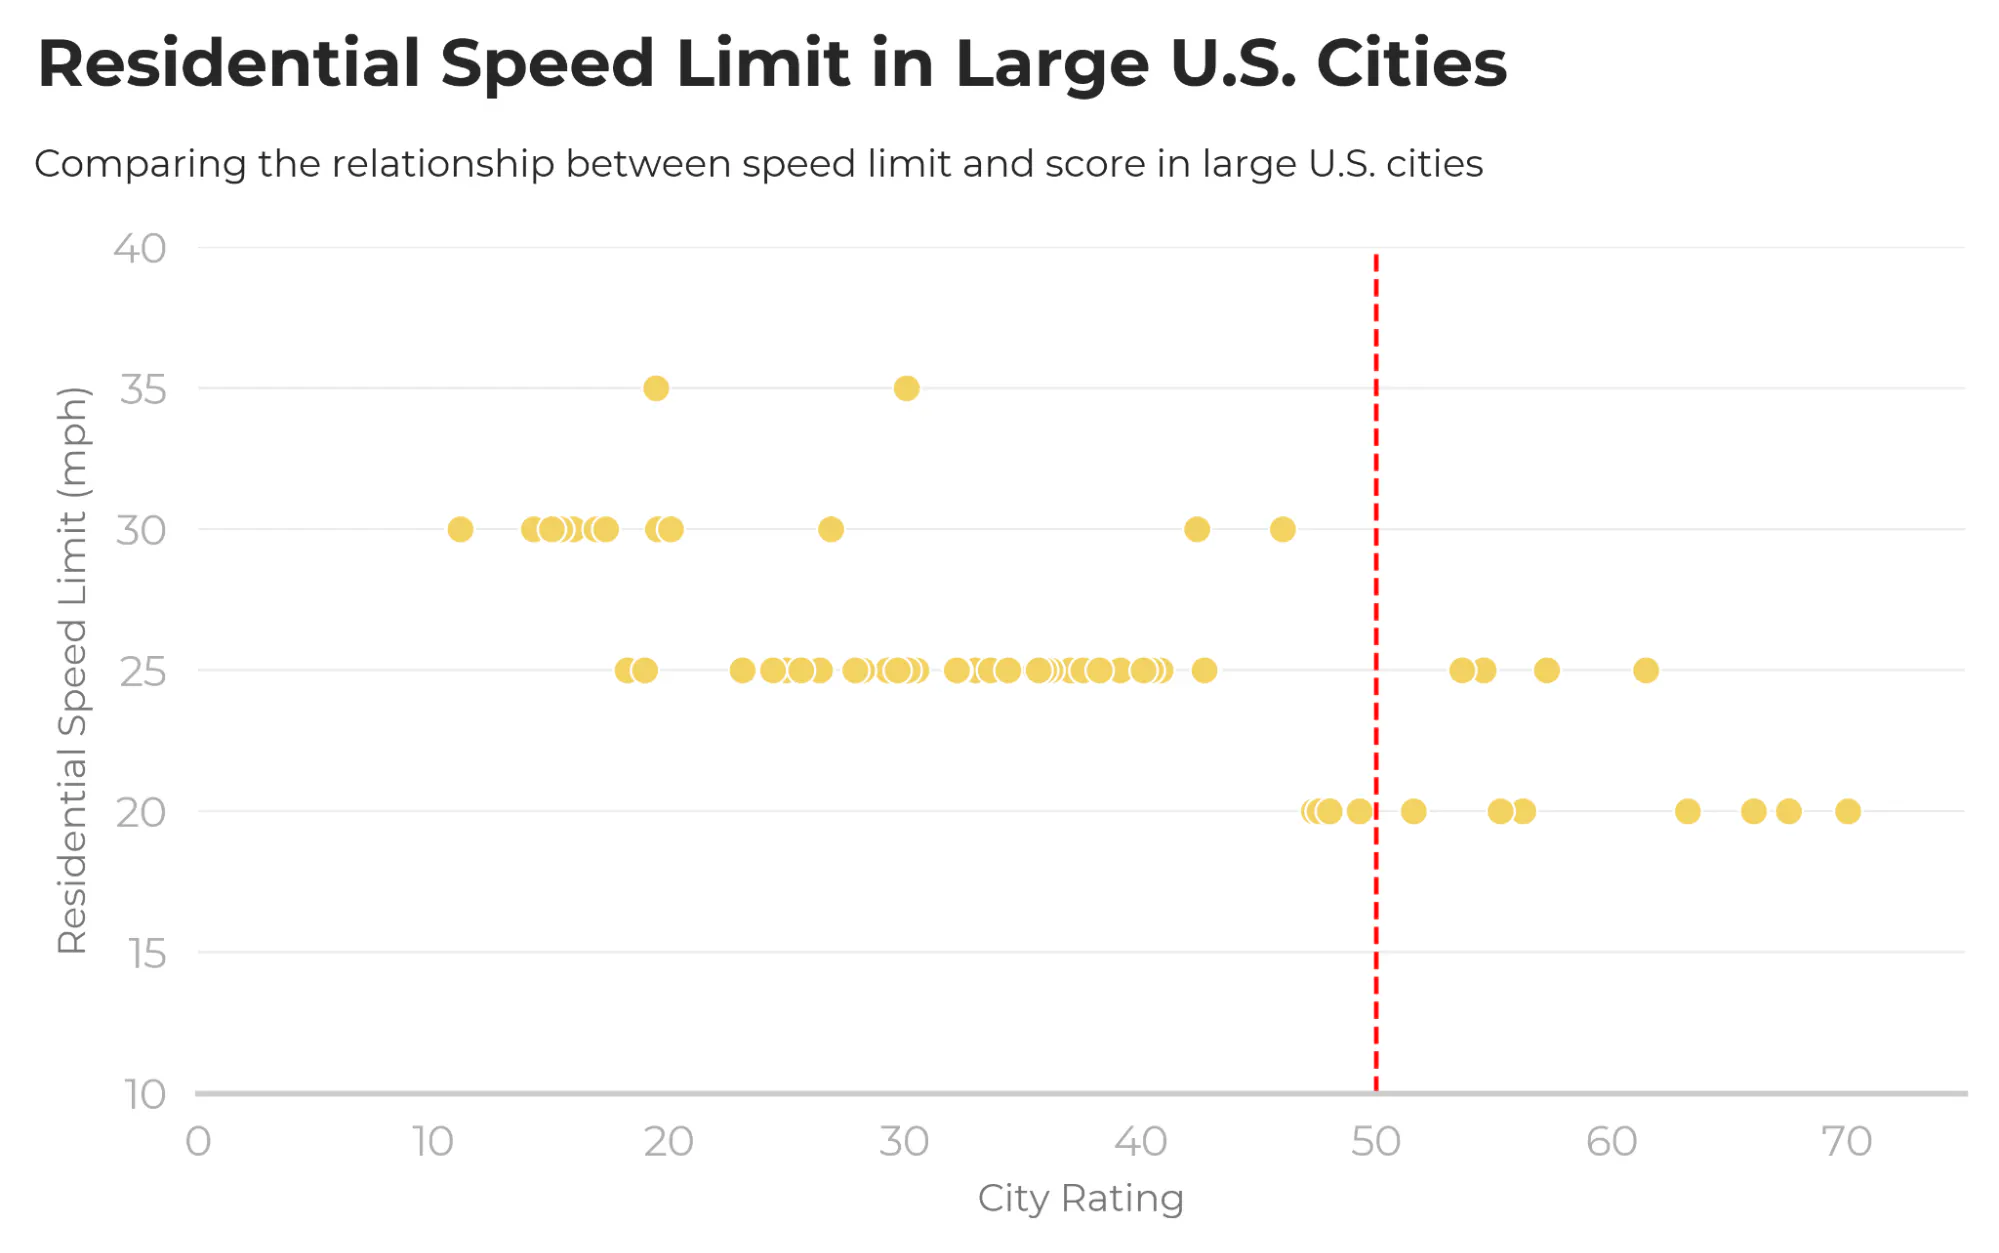
Among large cities near or above 50, the default residential speed limit is 25 mph or lower. These high-scoring cities have also implemented many other SPRINT principles such as protected bike lanes and network connectivity, but it’s difficult to get past the 20-point mark with speed limits of 30 mph or higher. For cities with speed limits of 25 mph in the 30–50 score range, working on network connections can make a big difference in getting to that critical score of 50.
Cities with high scores tend to have bike plans in place and are working to build them out. By taking a network approach (vs. focusing on individual projects), resources can be used to strategically fill in gaps or expand the reach of the existing network.
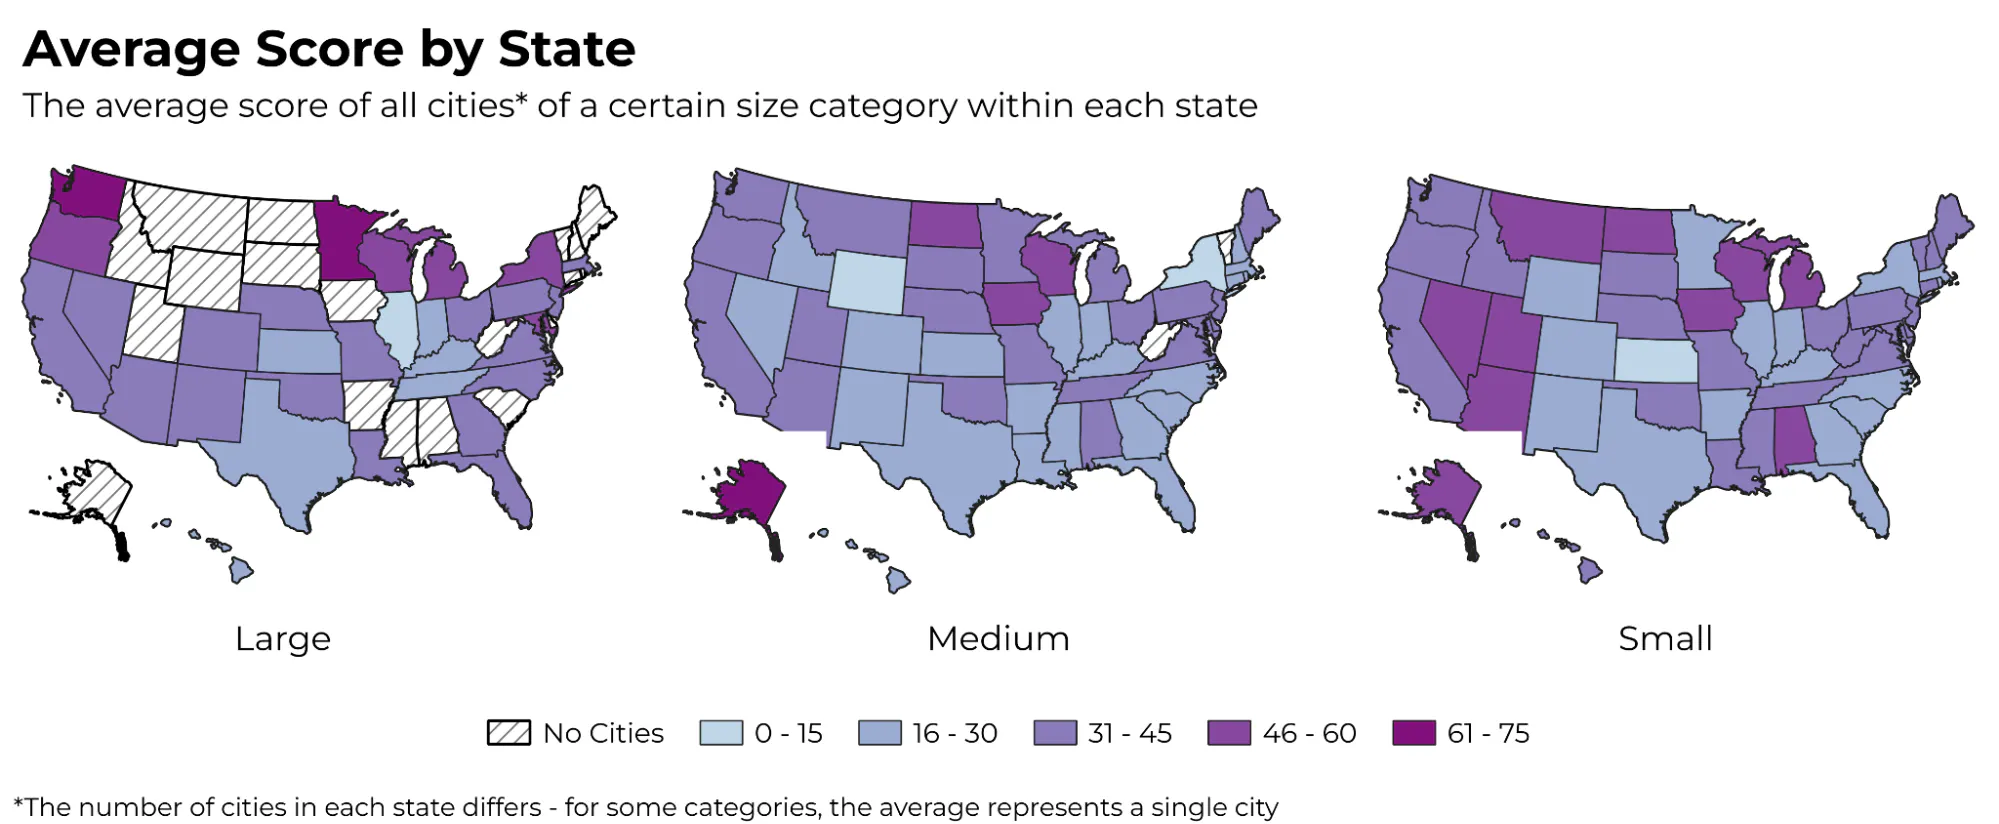
State and Regional Trends
State-level scores also reveal some notable trends. For some states, the average scores differ considerably by size. For example, small cities in Montana, Nevada, and Arizona score much higher than medium cities. Conversely, medium cities in Kansas, North Dakota, and Arkansas score higher than small cities. In Minnesota, the large cities (Minneapolis and St. Paul) outscore both medium and small cities. Texas is consistently low across all categories, though the large city average is boosted by Austin. Regionally, the South scores the lowest, while the Pacific and the Midwest score the highest.
Progress Made, Work Remaining
This year’s City Ratings is a celebration of continued progress and an opportunity for growth. In more cities than ever, Americans can reach the places they want to go via low-stress bike rides. For the almost 500 cities that currently fall in the “on the cusp” 40–50 range, applying proven interventions aligned with the SPRINT framework could push a significant number past the tipping point within the next few years. Sustained investment in bike-friendly policies and infrastructure will determine how many of those 500 cities cross the tipping point.
Full rankings and city profiles are available at cityratings.peopleforbikes.org. Maps and data are available at bna.peopleforbikes.org.
Related Topics:

Take Action
