

2019 Safest Cities
By: PeopleForBikes Staff
The characteristics of any sized city that scores well in Safety are people feeling safe, low fatality rates and low rates of injuries from traffic crashes. We know that more people ride — specifically more women ride — when they not only are safe, but also feel safe. Overall, a high safety score reflects dedication to a complete network with protected bike facilities. And increased safety leads to higher ridership numbers.
Our City Ratings Safety score comes from three sources of data, and takes into consideration how many people are riding in each place.
- Bike and all mode fatality rates. The Fatality Analysis Reporting System (FARS) reports on the number of fatalities associated with motor vehicle traffic crashes across the U.S. Because the number of fatalities at the city level tend to be small and variable from year to year, we averaged fatality rates across a rolling five-year period.
- Bike and all mode injury rates. The City Snapshot records the number of type A injuries (incapacitating; requiring ambulance transport) on an annual basis. Focusing on type A injuries provides a standard definition that allows us to compare across cities.
- Perceptions of safety. The PlacesForBikes Community Survey measures how people feel about bike riding in their communities. We know that many people won’t get on bikes if they don’t feel safe.
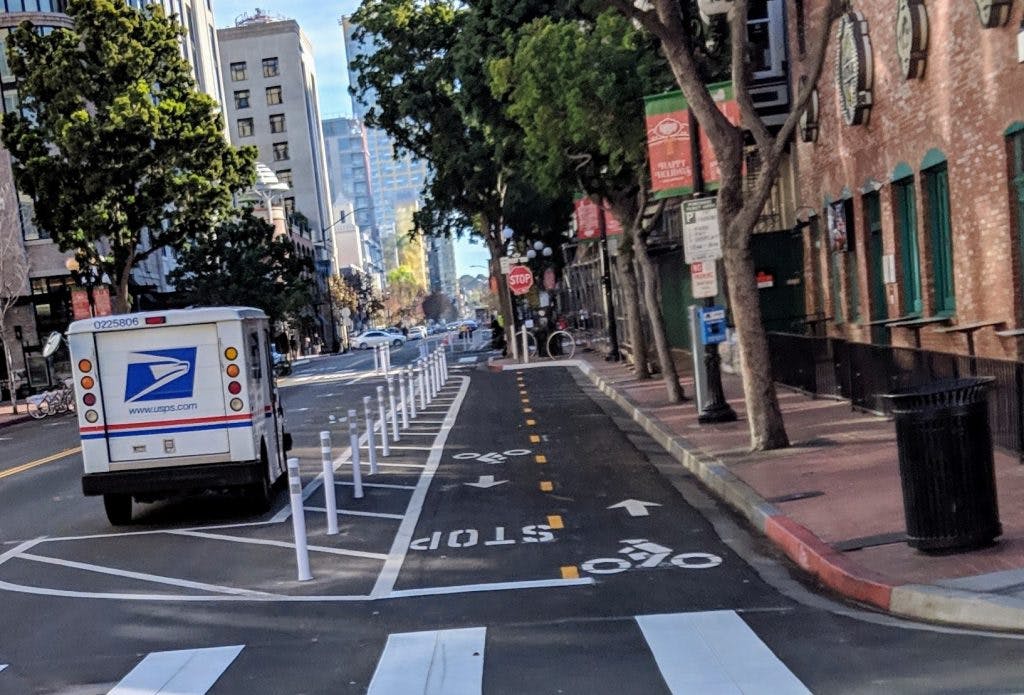
San Diego, California, population 1,390,966, Safety score: 3.3
Andy Hanshaw, Executive Director at the San Diego Bike Coalition, says that their approach to advocacy centers around education. Hanshaw says, “One way to help people feel safer is to make sure that they feel heard.” San Diego recently launched a “Get it Done” app that allows anyone in the community to report infrastructure problems such as hazardous potholes. The app allows people to review reports that have already been made, and to check the status of those reports. Hanshaw says there’s also a collaborative effort with the San Diego Police Department. “We’re grateful for our strong partnership and communication with the SDPD for education and safety programs.”
San Diego has an engaged Bicycle Advisory Board that recently transitioned it into a Mobility Board in order to best make decisions for all kinds of mobility. “In the last few years we’ve really put an emphasis on Vision Zero, resurfacing the streets, and a bicycle master plan to build a protected network,” says Hanshaw. San Diego’s next phase will add onto the new downtown cycle track, with a goal of growing the network and reaching all neighborhoods. Hanshaw says that by identifying their “fatal 15,” the city was able to make improvements to crosswalks and traffic slowing, especially in those areas where multiple incidents have occurred in the past. “We have a lot more work to do to build our network, and hopefully that will continue to improve our safety.”
Arlington, Virginia, population 229,534, Safety score: 4.4
Arlington wins our Safety category, overall. According to the most recent FARS data there hasn’t been a traffic-related fatality — for any mode of transportation, including bikes — within the city-limits of Arlington in five years (2013-2017).
Arlington was recently selected by the Virginia Highway Safety Office to receive a 2019 Governor’s Transportation Safety Award for the County’s Pedestrian Bicycle Crash Reduction Campaign The campaign coordinated education, engineering improvements and enforcement to address high-frequency bicycle and pedestrian accident locations.
Last month, the Arlington County Board approved the first comprehensive update since 2008. Eric Balliet, Communications Specialist for the Arlington County Department of Environmental Services, says the plan includes “more than 100 project concepts to help make Arlington a place where all persons can feel safe and comfortable while bicycling for transportation.”
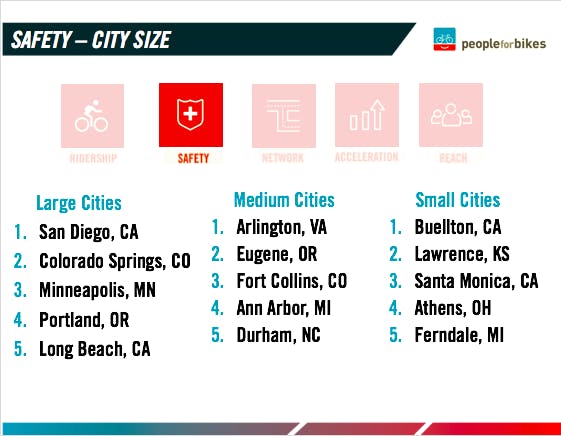
Eugene, Oregon, population 163,135, Safety score: 3.8
According to Shane MacRhodes, Transportation Options Coordinator, the focus in Eugene is on creating a safe place for families and all people in the community. “We just built the first section of a protected bikeway network that will link our shared-use path system up with family-friendly bikeways through the city.” MacRhodes says Eugene sees high ridership among students at the University of Oregon, and is working to get even more people biking for more trips more often. “With PeaceHealth Rides we have seen major success with more than 600 trips a day on our 300 bike system and more than 10,000 members registered.” In addition to bikeshare and infrastructure, Eugene boasts a robust Safe Routes to School program. MacRhodes says, “Our school districts are working to make walking and biking better for all families through a 9-hour bike safety education program offered to hundreds of students each Fall and Spring, as well as Walk+Roll Challenges happening in October and May.”
Buellton, California, population 5,087, Safety score: 4.3
Just off California’s highway 101, Buellton is a small town made up of low-stress residential streets. Avenue of the Flags, the main road that goes through town, has green bike lanes and bike signage throughout. Buellton sees a lot of tourists renting bikes or bringing their own for tours of wine country on two wheels. For that reason alone, the community has a high awareness of sharing the streets.
The great thing about small towns is there’s generally not a lot of people driving at high speeds, so they tend to have good safety records. Buellton enjoys a low volume of traffic moving at low speeds. While these traits naturally exist in small towns, many can be implemented in larger cities. One thing that any city can do to improve their safety is lower their speed limits. We know that reduced speed limits create safer places to live.
Recommendations for creating safer places:
- Create a Vision Zero policy with measurable goals and clear timeline. Measure current safety to create a baseline.
- Identify high-crash corridors and work with locals to find infrastructure fixes.
- Partner with police, elected officials and community groups to routinely collect, review and analyze crash data for all modes.
- Continuously monitor crash data to quickly address observed incidents. Prioritize infrastructure investments in underserved communities.
Related Topics:
Related Locations:

Take Action
