

2019 Most Complete Network Scores
By: PeopleForBikes Staff

Network is the category that cities have the most direct influence on — the one where big changes can actually be made. A more complete network leads to a higher level of safety and more ridership. Building a complete low-stress network is not fast or easy work. It’s not just sharrows and paint. It’s protected bike lanes and infrastructure that makes all people feel safe and like they want to be on a bike.
Prior to the PlacesForBikes program, communities struggled to consistently and reliably measure the quality of their bike networks. Network quality is assessed in the City Ratings by two factors:
- Bicycle Network Analysis – The BNA measures how easy it is for people in a community to get the places they want to go on a complete, comfortable, connected bike network. Scores range from 0 to 100 where 100 is a perfect score. In places that score 100, the bike network functions just like the road network.
- Perceptions of network quality. The Community Survey asks respondents to rate how complete, comfortable, and connected the bicycle network is in their community. We want to know how safe people are, and how safe they feel.
This year, our focus on accurately evaluating speed limits made some big differences in BNA scores. Because there’s such clear evidence that lower speed limits create safer spaces, we use them as an important measure when determining whether a street is low-stress or not. As our data accuracy has improved and continues to improve, we get a clearer sense of where the most complete networks really are.
While important, speed limits are only one piece of information used to get a picture of traffic stress. OpenStreetMap provides background information about the transportation systems in communities that helps complete our network analysis. A recent analysis looked at various ways of measuring the Level of Traffic Stress, and found that OSM is both low-cost and quite accurate. This analysis also allows us to improve the tool even more as OSM continues to be updated.
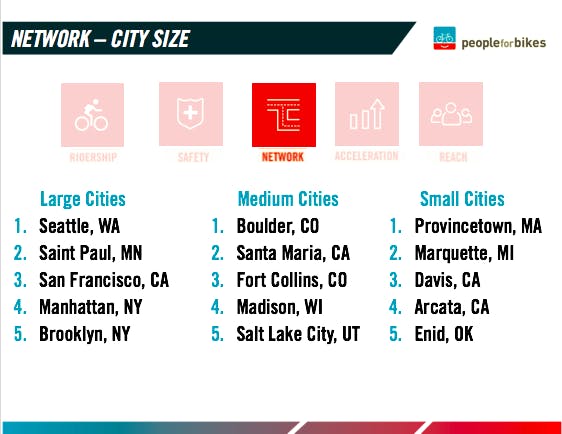
Seattle, Washington (population 688,245) Network score: 3.1
Over the last three years, Seattle has built 27 miles of new bicycle facilities. According to City Traffic Engineer Dongho Chang, “Mayor Durkan and SDOT Director Zimbabwe are committed to continuing to build a connected bicycle network as Seattle grows. Building a core set of connected bicycle network is critical to usability and ridership.”
The vision in Seattle’s Bicycle Master Plan is a city that’s safe, convenient, and attractive for all people to bike to where they need and want to go. The plan, originally created in 2014, maps out several different kinds of facilities, as well as end-of-trip accommodations such as short and long-term bicycle parking. The plan focuses on programming and educational opportunities, in addition to public engagement, data collection, technical analysis. Chang says, “Seattle has been fortunate to receive thoughtful input and feedback from communities on where we need to improve and connect. We are using open public process to update our six-year implementation plan, which will help us continue to maximize safety, connectivity, equity, ridership, and livability.”
When Seattle recently upgraded a major corridor from painted bike lanes to fully protected, ridership jumped more than 400%. Seattle is aware of the power of a protected lane versus a painted lane. Chang says, “The numbers show that people will use bicycle facilities when it is more comfortable and thoughtfully connected.”
Boulder, Colorado (population 106,271) Network score: 4.1
Boulder’s network includes multiple overpasses and underpasses, which allow people on bikes to avoid interactions with street traffic, allowing seamless network connectivity, even around the busiest intersections. Boulder also has many off-street bike paths that allow bikes and pedestrians a higher level of safety.
According to Senior Transportation Planner Dave Kemp, “Our work continues as we refine the seamless integration between our on and off street bike network.” Kemp says that the goal is to “help cyclists feel more comfortable for all types of trips through the new Low Stress Bike Network Plan.” That plan includes analysis of data collected from the BNA, Strava Metro Mobile app, walk and bike audits, collision tracking and close call reporting, and bicycle counting.
Provincetown, Massachusetts, (population 2,581) Network score: 4.5
David Gardner, Town Manager, says that Provincetown is continuing to invest in bike infrastructure in order to complete their network. Their master plan outlines a 25-mile extension to connect existing trails with the rest of the town and destinations. Gardner says, “We’re currently working on two major bike lane/ bike trail projects that will better connect the downtown area to the beaches and trails in the Cape Cod National Seashore.” Gardner says Provincetown strives to provide bikers with “a more harmonious coexistence with pedestrians and vehicles on our streets and throughout our neighborhoods.”
Recommendations for building a more complete network:
- Plan a bike network linking multiple districts. Use neighborhood bikeways on quiet streets, protected bike lanes on busy ones.
- Improve bike/walk links to parks, trails & mountain bike areas. Make at least one new link each year, prioritizing areas with low recreation access.
- Connect recreational biking sites to the transportation network.
- Add comfortable bike lanes to destination-rich arterials. It will be hard but worth it.
Related Topics:
Related Locations:

Take Action
